Describing Graphs of a Function
Quiz
•
Mathematics
•
8th Grade
•
Practice Problem
•
Hard
+1
Standards-aligned

Barbara White
FREE Resource
Enhance your content in a minute
15 questions
Show all answers
1.
MULTIPLE CHOICE QUESTION
2 mins • 1 pt

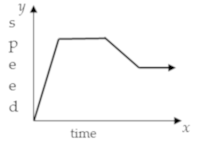
The graph shows how a motorboat travels around a lake. What does the graph most likely show?
The boat travels at a constant speed for 10 minutes and then stops.
The boat travels at a constant speed for 10 minutes and then slows down.
The boat steadily increases its speed for 10 minutes and then stops.
The boat steadily increases its speed for 10 minutes and then travels at a constant speed.
Tags
CCSS.HSF.IF.B.4
2.
MULTIPLE CHOICE QUESTION
2 mins • 1 pt
The value of a stock decreases sharply for 2 weeks, then increases sharply for 1 week,
and then decreases sharply again for 2 weeks.
Which graph shows the relationship between the value of the stock and time?


Tags
CCSS.8.EE.B.5
3.
MULTIPLE CHOICE QUESTION
2 mins • 1 pt
Mr. Harris attaches a full tank of propane to his grill. Then he turns on the grill and cooks food for a barbecue.
Which graph shows the relationship between the amount of propane in the tank and time?


Tags
CCSS.8.EE.B.5
4.
MULTIPLE CHOICE QUESTION
2 mins • 1 pt
Liana hikes slowly away from her campsite for 30 minutes. Then she rests for 10 minutes.
Finally she hikes back to her campsite at a faster pace, reaching it in 20 minutes.
Which graph could represent Liana's distance from the campsite and time?


Tags
CCSS.HSF.IF.B.4
5.
MULTIPLE CHOICE QUESTION
2 mins • 1 pt
A basketball player throws a ball upward from her hands, which are 5 feet above the ground.
The basketball reaches a maximum height, and then gets stuck in the net.
Which graph could represent the relationship between the height of the ball and time?


Tags
CCSS.HSF-IF.C.7A
6.
MULTIPLE CHOICE QUESTION
30 sec • 1 pt

Over which interval of time is this person returning home?
A: 8:00 < x < 9:00
B: 9:00 < x < 9:30
C: 9:30 < x < 11:00
D: 11:00 < x < 12:00
E: 12:00 < x < 13:00
Tags
CCSS.HSF.IF.B.4
7.
MULTIPLE CHOICE QUESTION
2 mins • 1 pt

Which interval shows a slope of zero?
x > 4
-1 to 2
x < -4
2 to 3
Access all questions and much more by creating a free account
Create resources
Host any resource
Get auto-graded reports

Continue with Google

Continue with Email

Continue with Classlink

Continue with Clever
or continue with

Microsoft
%20(1).png)
Apple
Others
Already have an account?
Similar Resources on Wayground

11 questions
IPA Asyik
Quiz
•
8th Grade

20 questions
CAPS Grade 9 Algebraic Expressions Quiz
Quiz
•
8th - 9th Grade

12 questions
Q2 - MATH8 (CER PRACTICE)
Quiz
•
8th Grade

20 questions
weekly online homework term 2 week 3
Quiz
•
8th Grade

15 questions
KUASA TIGA DAN PUNCA KUASA TIGA
Quiz
•
7th - 9th Grade

15 questions
Pythagorean Theorem Test
Quiz
•
8th - 9th Grade

10 questions
MGSE.7.G2 (Triangles)
Quiz
•
KG - University

20 questions
Linear Relationships Review
Quiz
•
8th - 9th Grade
Popular Resources on Wayground

15 questions
Fractions on a Number Line
Quiz
•
3rd Grade

20 questions
Equivalent Fractions
Quiz
•
3rd Grade

25 questions
Multiplication Facts
Quiz
•
5th Grade

54 questions
Analyzing Line Graphs & Tables
Quiz
•
4th Grade

22 questions
fractions
Quiz
•
3rd Grade

20 questions
Main Idea and Details
Quiz
•
5th Grade

20 questions
Context Clues
Quiz
•
6th Grade

15 questions
Equivalent Fractions
Quiz
•
4th Grade
Discover more resources for Mathematics

14 questions
finding slope from a graph
Quiz
•
8th Grade

20 questions
Laws of Exponents
Quiz
•
8th Grade

12 questions
8th U5L9 Linear Models
Quiz
•
8th Grade

20 questions
Graphing Inequalities on a Number Line
Quiz
•
6th - 9th Grade

20 questions
Volume of cylinders, Cones and Spheres
Quiz
•
8th Grade

20 questions
One Step equations addition and subtraction
Quiz
•
5th - 8th Grade

20 questions
Mean, Median, Mode, and Range
Quiz
•
8th Grade

15 questions
Volume of a Cylinder
Quiz
•
8th Grade


