Line Plot Pictograph Bar Graph
Authored by Barbara White
Mathematics
3rd Grade
CCSS covered
Used 1+ times

AI Actions
Add similar questions
Adjust reading levels
Convert to real-world scenario
Translate activity
More...
Content View
Student View
11 questions
Show all answers
1.
MULTIPLE CHOICE QUESTION
1 min • 1 pt

How many more students played soccer than football?
2.
MULTIPLE CHOICE QUESTION
1 min • 1 pt

How many students take the bus to school?
Tags
CCSS.5.G.A.2
3.
MULTIPLE CHOICE QUESTION
1 min • 1 pt

How many mountain bikes were sold?
4.
MULTIPLE CHOICE QUESTION
30 sec • 1 pt

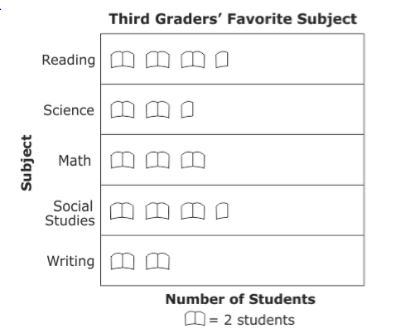
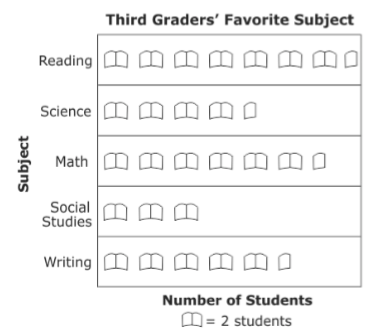
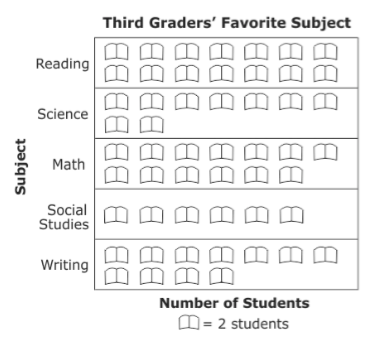
How many votes did reading and social studies receive together?
5.
MULTIPLE CHOICE QUESTION
10 sec • 1 pt

Which fruit was the most popular?
6.
MULTIPLE CHOICE QUESTION
5 mins • 1 pt

How many more people like the color purple than blue?
7.
MULTIPLE CHOICE QUESTION
45 sec • 1 pt

How many people like either mushroom or pepperoni the best?
Access all questions and much more by creating a free account
Create resources
Host any resource
Get auto-graded reports

Continue with Google

Continue with Email

Continue with Classlink

Continue with Clever
or continue with

Microsoft
%20(1).png)
Apple
Others
Already have an account?
Similar Resources on Wayground

10 questions
Fractions Number Line
Quiz
•
KG - University

10 questions
MUSIC MATHS
Quiz
•
KG - 5th Grade

10 questions
Multiplication arrays
Quiz
•
2nd - 3rd Grade

11 questions
English Questionnaire
Quiz
•
3rd Grade

10 questions
Semi-Final Quiz F
Quiz
•
3rd Grade

10 questions
3- digit addition
Quiz
•
2nd - 3rd Grade

10 questions
MENTAL ARITHMETIC
Quiz
•
3rd Grade

13 questions
fractions multipication
Quiz
•
2nd - 3rd Grade
Popular Resources on Wayground

15 questions
Fractions on a Number Line
Quiz
•
3rd Grade

20 questions
Equivalent Fractions
Quiz
•
3rd Grade

25 questions
Multiplication Facts
Quiz
•
5th Grade

54 questions
Analyzing Line Graphs & Tables
Quiz
•
4th Grade

22 questions
fractions
Quiz
•
3rd Grade

20 questions
Main Idea and Details
Quiz
•
5th Grade

20 questions
Context Clues
Quiz
•
6th Grade

15 questions
Equivalent Fractions
Quiz
•
4th Grade
Discover more resources for Mathematics

15 questions
Fractions on a Number Line
Quiz
•
3rd Grade

20 questions
Equivalent Fractions
Quiz
•
3rd Grade

22 questions
fractions
Quiz
•
3rd Grade

18 questions
Comparing Fractions with same numerator or denominator
Quiz
•
3rd Grade

12 questions
Fractions on a numberline review
Quiz
•
3rd Grade

10 questions
Area
Quiz
•
3rd Grade

20 questions
Fractions
Quiz
•
3rd Grade

100 questions
100 multiplication facts
Quiz
•
3rd Grade


