
Graphs Data Plots
Authored by Anthony Clark
Mathematics
7th Grade
CCSS covered


AI Actions
Add similar questions
Adjust reading levels
Convert to real-world scenario
Translate activity
More...
Content View
Student View
11 questions
Show all answers
1.
MULTIPLE CHOICE QUESTION
1 min • 1 pt

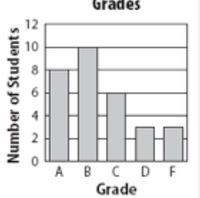
Which grade describes the center of data?
65
75
60
2.
MULTIPLE CHOICE QUESTION
1 min • 1 pt

Jamie practiced for her piano recital for 5 days in a row.
What is the sum of hours she practiced on Day 1 and Day 3?
1
2
10
5
Tags
CCSS.3.OA.D.8
3.
MULTIPLE CHOICE QUESTION
1 min • 1 pt

The X axis title is
Time (weeks)
Plant Height (cm)
1, 2, 3, 4, 5
Plant Height (cm) vs. Time (weeks)
Tags
CCSS.2.MD.D.9
4.
MULTIPLE CHOICE QUESTION
1 min • 1 pt
The Y axis title is
Time (weeks)
Plant Height (cm)
Data points
1, 2, 3, 4, 5
Tags
CCSS.2.MD.D.9
5.
MULTIPLE CHOICE QUESTION
1 min • 1 pt

What is the difference between the highest score and the lowest score on the test?
15
100
6
10
Tags
CCSS.3.MD.B.4
6.
MULTIPLE CHOICE QUESTION
1 min • 1 pt

How many students take the bus to school?
35
20
10
15
Tags
CCSS.5.G.A.2
7.
MULTIPLE CHOICE QUESTION
1 min • 1 pt

How many more people like red than purple?
100
10
2
5
Tags
CCSS.1.NBT.A.1


Access all questions and much more by creating a free account
Create resources
Host any resource
Get auto-graded reports

Continue with Google

Continue with Email

Continue with Microsoft
or continue with

%20(1).png)
Apple

Others
Already have an account?



