
Representing and Interpreting Data
Quiz
•
Mathematics
•
5th Grade
•
Practice Problem
•
Hard
Standards-aligned

Anthony Clark
FREE Resource
Enhance your content in a minute
15 questions
Show all answers
1.
MULTIPLE CHOICE QUESTION
1 min • 1 pt

Which sport was picked by the same number of girls and boys?
tennis
football
netball
rugby
2.
MULTIPLE CHOICE QUESTION
1 min • 1 pt

Which day had more minutes of homework?
Wednesday
Thursday
Friday
Ms. Jones
Tags
CCSS.5.G.A.2
3.
MULTIPLE CHOICE QUESTION
1 min • 1 pt

The under 13's played 28 matches.
The under 15's played 18 matches.
Which team won more matches?
Under 13's
Under 15's
Tags
CCSS.2.MD.D.9
4.
MULTIPLE CHOICE QUESTION
1 min • 1 pt

Which pie chart represents the same data as the table?

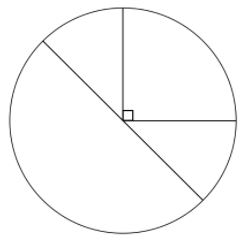
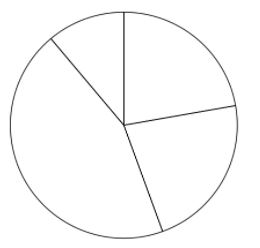
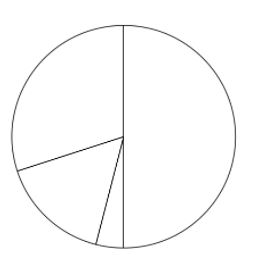
5.
MULTIPLE CHOICE QUESTION
1 min • 1 pt

What is the difference between the amount of minutes of homework set by Ms Jones on Wednesday and Thursday?
4
3
2
6
Tags
CCSS.3.MD.B.4
6.
MULTIPLE CHOICE QUESTION
1 min • 1 pt
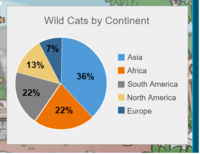
1% on the pie chart is worth 4000 wild cats. How many wild cats does Africa have?
4000
88000
22000
8800
7.
MULTIPLE CHOICE QUESTION
1 min • 1 pt
Find the median from the list of numbers:
60, 58, 52, 48, 60, 67
58
59
60
118
Access all questions and much more by creating a free account
Create resources
Host any resource
Get auto-graded reports

Continue with Google

Continue with Email

Continue with Classlink

Continue with Clever
or continue with

Microsoft
%20(1).png)
Apple
Others
Already have an account?
Similar Resources on Wayground

20 questions
MAT S213 Reviewer 2
Quiz
•
12th Grade

20 questions
Algebraic Expressions 23rd June
Quiz
•
6th Grade

10 questions
Maths Revision Quiz (1) - Grade 3
Quiz
•
3rd Grade - University

10 questions
SOLVING EQUATIONS
Quiz
•
12th Grade

20 questions
Symmetry of a Shape
Quiz
•
6th Grade

10 questions
HSCP Year 5 NAPLAN Revision - Set 4
Quiz
•
5th Grade

10 questions
CIRCLE 10
Quiz
•
10th Grade

10 questions
Rounding Off Decimal Numbers
Quiz
•
5th Grade
Popular Resources on Wayground

15 questions
Fractions on a Number Line
Quiz
•
3rd Grade

20 questions
Equivalent Fractions
Quiz
•
3rd Grade

25 questions
Multiplication Facts
Quiz
•
5th Grade

22 questions
fractions
Quiz
•
3rd Grade

20 questions
Main Idea and Details
Quiz
•
5th Grade

20 questions
Context Clues
Quiz
•
6th Grade

15 questions
Equivalent Fractions
Quiz
•
4th Grade

20 questions
Figurative Language Review
Quiz
•
6th Grade
Discover more resources for Mathematics

25 questions
Multiplication Facts
Quiz
•
5th Grade

10 questions
Multiplying Fractions
Quiz
•
5th Grade

20 questions
Multiplying and Dividing Decimals
Quiz
•
5th Grade

15 questions
Converting Mixed Numbers and Improper Fractions
Quiz
•
4th - 5th Grade

21 questions
Adding and subtracting fractions with like denominators
Quiz
•
3rd - 5th Grade

15 questions
Adding and Subtracting Fractions - Unlike denominators
Quiz
•
5th Grade

20 questions
One Step equations addition and subtraction
Quiz
•
5th - 8th Grade

10 questions
Adding and Subtracting Mixed Numbers
Quiz
•
5th Grade


