Graphing Linear Equations Test
Authored by Anthony Clark
Mathematics
9th Grade
CCSS covered

AI Actions
Add similar questions
Adjust reading levels
Convert to real-world scenario
Translate activity
More...
Content View
Student View
20 questions
Show all answers
1.
MULTIPLE CHOICE QUESTION
1 min • 1 pt

Which graph represents the table?


Tags
CCSS.8.EE.B.5
2.
MULTIPLE CHOICE QUESTION
1 min • 1 pt

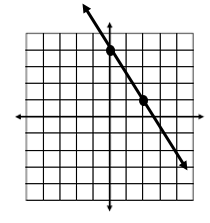
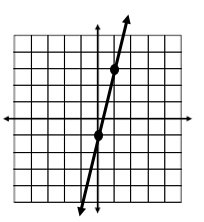
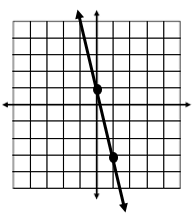
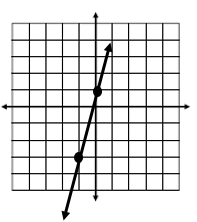
Which is the graph of y= -x + 2?
A
B
C
D
3.
MULTIPLE CHOICE QUESTION
1 min • 1 pt

Find the slope.
3/2
-3/2
(-0,-3)
none of the above
Tags
CCSS.8.EE.B.5
4.
MULTIPLE CHOICE QUESTION
1 min • 1 pt

Which equation represents the following graph?
y = 3x + 2
y = -2x + 3
y = 2x + 3
y = -3x + 2
5.
LABELLING QUESTION
1 min • 1 pt
Label each line with the correct equation.
Tags
CCSS.8.F.B.4
CCSS.HSF.LE.A.2
6.
DRAW QUESTION
1 min • Ungraded
Graph the line y= 1/4x + 3.

Answer explanation

Your line should begin at 3 on the y-axis, then move up 1 and to the right 4.
7.
MULTIPLE CHOICE QUESTION
1 min • 1 pt

What is the x- intercept of the line?
x = 1
x = 2
x = -1
x = -2
Access all questions and much more by creating a free account
Create resources
Host any resource
Get auto-graded reports
Continue with Google

Continue with Email
Continue with Classlink
Continue with Clever
or continue with
Microsoft
%20(1).png)
Apple
Others
Already have an account?
Similar Resources on Wayground

20 questions
MATEMATICAS 3º ESO BLOQUE 2 CRT 2 (PROGRESIONES)
Quiz
•
9th Grade
20 questions
Radical Equations
Quiz
•
9th Grade
20 questions
PTS KLS 7
Quiz
•
7th - 9th Grade
21 questions
Cubic volume
Quiz
•
7th - 12th Grade
15 questions
KUASA TIGA DAN PUNCA KUASA TIGA
Quiz
•
7th - 9th Grade
15 questions
Pythagorean Theorem Test
Quiz
•
8th - 9th Grade
20 questions
Linear Relationships Review
Quiz
•
8th - 9th Grade
20 questions
CAPS Grade 9 Algebraic Expressions Quiz
Quiz
•
8th - 9th Grade
Popular Resources on Wayground
15 questions
Fractions on a Number Line
Quiz
•
3rd Grade
20 questions
Equivalent Fractions
Quiz
•
3rd Grade
25 questions
Multiplication Facts
Quiz
•
5th Grade
22 questions
fractions
Quiz
•
3rd Grade
20 questions
Main Idea and Details
Quiz
•
5th Grade
20 questions
Context Clues
Quiz
•
6th Grade
15 questions
Equivalent Fractions
Quiz
•
4th Grade
20 questions
Figurative Language Review
Quiz
•
6th Grade
Discover more resources for Mathematics
20 questions
Graphing Inequalities on a Number Line
Quiz
•
6th - 9th Grade
12 questions
Exponential Growth and Decay
Quiz
•
9th Grade
20 questions
Exponent Rules Review
Quiz
•
8th - 9th Grade
25 questions
Complementary and Supplementary Angles
Quiz
•
7th - 10th Grade
12 questions
Add and Subtract Polynomials
Quiz
•
9th - 12th Grade
13 questions
Model Exponential Growth and Decay Scenarios
Quiz
•
9th - 12th Grade
15 questions
Combine Like Terms and Distributive Property
Quiz
•
8th - 9th Grade
27 questions
7.2.3 Quadrilateral Properties
Quiz
•
9th - 12th Grade