Linear Inequality in Two Variables
Authored by Anthony Clark
Mathematics
8th Grade
CCSS covered

AI Actions
Add similar questions
Adjust reading levels
Convert to real-world scenario
Translate activity
More...
Content View
Student View
12 questions
Show all answers
1.
MULTIPLE CHOICE QUESTION
1 min • 5 pts

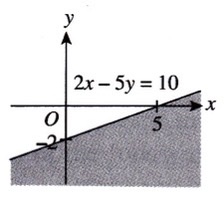
Choose the correct inequality for this graph.
Tags
CCSS.HSA.REI.D.12
2.
MULTIPLE CHOICE QUESTION
1 min • 5 pts

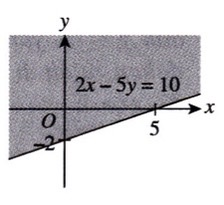
Choose the correct inequality for this graph.
Tags
CCSS.HSA.REI.D.12
3.
MULTIPLE CHOICE QUESTION
1 min • 5 pts

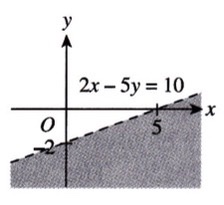
Choose the correct inequality for this graph.
Tags
CCSS.HSA.REI.D.12
4.
MULTIPLE CHOICE QUESTION
1 min • 5 pts

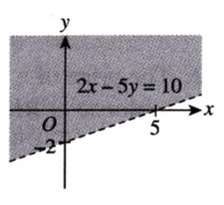
Choose the correct inequality for this graph.
Tags
CCSS.HSA.REI.D.12
5.
MULTIPLE CHOICE QUESTION
1 min • 5 pts
Consider the function y < 2x + 3, which of the following is true?
The line would be solid with shading above.
The line would be dashed with shading above.
The line would be solid with shading below.
The line would be dashed with shading below.
Tags
CCSS.HSA.REI.D.12
6.
MULTIPLE CHOICE QUESTION
1 min • 5 pts

Choose the correct inequality for this graph.
Tags
CCSS.HSA.REI.D.12
7.
MULTIPLE CHOICE QUESTION
1 min • 5 pts

Choose the correct inequality for this graph.
Tags
CCSS.6.EE.B.8

Access all questions and much more by creating a free account
Create resources
Host any resource
Get auto-graded reports
Continue with Google

Continue with Email
Continue with Classlink
Continue with Clever
or continue with
Microsoft
%20(1).png)
Apple
Others
Already have an account?
Similar Resources on Wayground

12 questions
Polinómios
Quiz
•
8th Grade
10 questions
19 NMMS અંગ્રેજી મૂળાક્ષર શ્રેણી
Quiz
•
8th Grade
17 questions
graphing inequalities
Quiz
•
8th - 12th Grade
10 questions
8M Surface Area of Cones
Quiz
•
8th Grade
15 questions
लसावि व मसावि
Quiz
•
5th Grade - University
12 questions
Solve 2-step equations with integers
Quiz
•
7th - 8th Grade
15 questions
linear function properties
Quiz
•
8th Grade
15 questions
Area of Kites, Rhombuses, and Trapeziums
Quiz
•
7th - 8th Grade
Popular Resources on Wayground
7 questions
History of Valentine's Day
Interactive video
•
4th Grade
15 questions
Fractions on a Number Line
Quiz
•
3rd Grade
20 questions
Equivalent Fractions
Quiz
•
3rd Grade
25 questions
Multiplication Facts
Quiz
•
5th Grade
22 questions
fractions
Quiz
•
3rd Grade
15 questions
Valentine's Day Trivia
Quiz
•
3rd Grade
20 questions
Main Idea and Details
Quiz
•
5th Grade
20 questions
Context Clues
Quiz
•
6th Grade
Discover more resources for Mathematics
20 questions
Laws of Exponents
Quiz
•
8th Grade
20 questions
Graphing Inequalities on a Number Line
Quiz
•
6th - 9th Grade
16 questions
2022 Winter Olympics Medal Table
Passage
•
6th - 8th Grade
20 questions
Complementary Supplementary Vertical Adjacent Angles
Quiz
•
8th Grade
20 questions
One Step equations addition and subtraction
Quiz
•
5th - 8th Grade
12 questions
Volume of cones and cylinders
Quiz
•
8th Grade
20 questions
Slope from a Graph
Quiz
•
8th Grade
15 questions
Combine Like Terms and Distributive Property
Quiz
•
8th - 9th Grade