Interpret Proportional Graphs
Authored by Anthony Clark
Mathematics
7th Grade
CCSS covered

AI Actions
Add similar questions
Adjust reading levels
Convert to real-world scenario
Translate activity
More...
Content View
Student View
20 questions
Show all answers
1.
MULTIPLE CHOICE QUESTION
1 min • 5 pts

What does the point (3, 9) represent?
There are 3 feet in 9 yards.
There are 9 feet in 3 yards.
Tags
CCSS.7.RP.A.2D
2.
MULTIPLE CHOICE QUESTION
1 min • 5 pts
What is the constant of proportionality
m = 1/3
m = 9
m = 3/9
m = 3
Tags
CCSS.7.RP.A.2B
3.
MULTIPLE CHOICE QUESTION
1 min • 5 pts

What does the point (8, 4) represent?
8 hours of charge will give you 4 hours of flight time
4 hours of charge will give you 8 hours of flight time
Tags
CCSS.HSF.IF.B.4
4.
MULTIPLE CHOICE QUESTION
1 min • 5 pts

What does the point (1, 4) represent?
4 miles per hour
4 hours per mile
Tags
CCSS.8.EE.B.5
5.
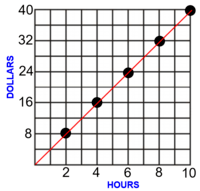
MULTIPLE CHOICE QUESTION
1 min • 1 pt

Which of the following statements can be used to create the graph shown?
For every 5 hours of work you get $6
For every 24 hours of work you get $10
For every 36 hours of work you get $50
For every 6 hours of work you get $5
Tags
CCSS.7.RP.A.2D
6.
MULTIPLE CHOICE QUESTION
1 min • 1 pt

Which graph is proportional?
A
B
C and D
All of the graphs are proportional
Tags
CCSS.7.RP.A.2D
7.
MULTIPLE CHOICE QUESTION
1 min • 1 pt

The graph shows the relationship between x, the weight in pounds, and y, the cost in dollars of sliced turkey.
How much would 9 pounds of sliced turkey cost?
$22.50
$54
$3.60
$2.50
Tags
CCSS.7.RP.A.2B


Access all questions and much more by creating a free account
Create resources
Host any resource
Get auto-graded reports
Continue with Google

Continue with Email
Continue with Classlink
Continue with Clever
or continue with
Microsoft
%20(1).png)
Apple
Others
Already have an account?
Similar Resources on Wayground

20 questions
Linear Relationships Review
Quiz
•
8th - 9th Grade
20 questions
weekly online homework term 2 week 3
Quiz
•
8th Grade
20 questions
Radical Equations
Quiz
•
9th Grade
20 questions
Matrix
Quiz
•
University
15 questions
7th Grade Math - Test Review (Algebra)
Quiz
•
7th Grade
21 questions
Cubic volume
Quiz
•
7th - 12th Grade
15 questions
KUASA TIGA DAN PUNCA KUASA TIGA
Quiz
•
7th - 9th Grade
20 questions
PROPORTIONS REVIEW
Quiz
•
7th Grade
Popular Resources on Wayground
15 questions
Fractions on a Number Line
Quiz
•
3rd Grade
20 questions
Equivalent Fractions
Quiz
•
3rd Grade
25 questions
Multiplication Facts
Quiz
•
5th Grade
54 questions
Analyzing Line Graphs & Tables
Quiz
•
4th Grade
22 questions
fractions
Quiz
•
3rd Grade
20 questions
Main Idea and Details
Quiz
•
5th Grade
20 questions
Context Clues
Quiz
•
6th Grade
15 questions
Equivalent Fractions
Quiz
•
4th Grade
Discover more resources for Mathematics
22 questions
distributive property
Quiz
•
7th Grade
18 questions
Angle Relationships
Quiz
•
7th Grade
20 questions
How Some Friendships Last — and Others Don’t Video Questions
Quiz
•
7th Grade
18 questions
Handbook Refresher Quiz
Quiz
•
7th Grade
20 questions
Graphing Inequalities on a Number Line
Quiz
•
6th - 9th Grade
20 questions
graphing inequalities
Quiz
•
6th - 7th Grade
16 questions
Adding and Subtracting Integers
Quiz
•
7th Grade
20 questions
Angles: Complementary/Supplementary/ Vertical/ Adjacent
Quiz
•
7th Grade