Functions Increasing vs Decreasing
Authored by Anthony Clark
Mathematics
9th Grade
CCSS covered

AI Actions
Add similar questions
Adjust reading levels
Convert to real-world scenario
Translate activity
More...
Content View
Student View
15 questions
Show all answers
1.
MULTIPLE CHOICE QUESTION
1 min • 1 pt
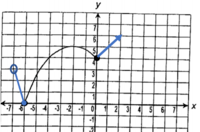
What is the decreasing interval(s) on the function shown?
2.
MULTIPLE CHOICE QUESTION
1 min • 1 pt

What is the decreasing interval on the function shown?
3.
MULTIPLE CHOICE QUESTION
1 min • 1 pt
What is the increasing interval on the function shown?
4.
MULTIPLE CHOICE QUESTION
1 min • 1 pt

Assume the distance vs time graph represents the distance of three runners from the starting point of the race.
Which runner gradually increased their speed?
A
B
C
Tags
CCSS.HSF.IF.B.4
5.
MULTIPLE CHOICE QUESTION
1 min • 1 pt

Assume the distance vs time graph represents the distance of three runners from the starting point of the race.
Which runner maintained a steady pace throughout the race?
A
B
C
Tags
CCSS.8.EE.B.5
6.
MULTIPLE CHOICE QUESTION
1 min • 1 pt

Assume the distance vs time graph represents the distance of three runners from the starting point of the race.
Which runner slowed down at the end of the race?
A
B
C
Tags
CCSS.HSF.IF.B.4
7.
MULTIPLE CHOICE QUESTION
1 min • 1 pt

The graph represents the relation of distance and time.
What relationship does this graph represent?
An object moving away and increasing speed.
An object moving closer at a decreasing speed.
An object moving away at a constant speed.
An object at rest and not changing its distance.
Tags
CCSS.8.EE.B.5


Access all questions and much more by creating a free account
Create resources
Host any resource
Get auto-graded reports
Continue with Google

Continue with Email
Continue with Classlink
Continue with Clever
or continue with
Microsoft
%20(1).png)
Apple
Others
Already have an account?
Similar Resources on Wayground

10 questions
M9 PAT Prep
Quiz
•
7th - 9th Grade
15 questions
Ordered Pair
Quiz
•
9th Grade - University
10 questions
Missing Number to 120
Quiz
•
1st Grade - University
10 questions
Term2 revision for the monthly test y3
Quiz
•
3rd Grade - University
10 questions
Quarter 4 Math 3 Week 7
Quiz
•
9th Grade
12 questions
Revision - BOMDAS, Rates, Ratios, Best buys and Percentages
Quiz
•
9th - 10th Grade
10 questions
Maths
Quiz
•
KG - 12th Grade
15 questions
Adding and subtracting polynomials
Quiz
•
9th Grade - University
Popular Resources on Wayground
15 questions
Fractions on a Number Line
Quiz
•
3rd Grade
20 questions
Equivalent Fractions
Quiz
•
3rd Grade
25 questions
Multiplication Facts
Quiz
•
5th Grade
22 questions
fractions
Quiz
•
3rd Grade
20 questions
Main Idea and Details
Quiz
•
5th Grade
20 questions
Context Clues
Quiz
•
6th Grade
15 questions
Equivalent Fractions
Quiz
•
4th Grade
20 questions
Figurative Language Review
Quiz
•
6th Grade
Discover more resources for Mathematics
20 questions
Graphing Inequalities on a Number Line
Quiz
•
6th - 9th Grade
12 questions
Exponential Growth and Decay
Quiz
•
9th Grade
20 questions
Exponent Rules Review
Quiz
•
8th - 9th Grade
25 questions
Complementary and Supplementary Angles
Quiz
•
7th - 10th Grade
12 questions
Add and Subtract Polynomials
Quiz
•
9th - 12th Grade
13 questions
Model Exponential Growth and Decay Scenarios
Quiz
•
9th - 12th Grade
15 questions
Combine Like Terms and Distributive Property
Quiz
•
8th - 9th Grade
27 questions
7.2.3 Quadrilateral Properties
Quiz
•
9th - 12th Grade