Creating and Interpreting Graphs of Functions
Quiz
•
Mathematics
•
9th Grade
•
Hard
+2
Standards-aligned

Anthony Clark
FREE Resource
10 questions
Show all answers
1.
MULTIPLE CHOICE QUESTION
1 min • 1 pt
X-intercept is :
all values used along the x-axis.
all values used along the y-axis.
where the line or dot intersects the x-axis.
where the line or dot intersects the y-axis.
2.
MULTIPLE CHOICE QUESTION
1 min • 1 pt
Y-intercept is :
all values used along the x-axis.
all values used along the y-axis.
where the line or dot intersects the x-axis.
where the line or dot intersects the y-axis.
3.
MULTIPLE CHOICE QUESTION
1 min • 1 pt
Maximum is:
when points on a graph are connected.
when points on a graph are not connected.
the highest point on the y-axis.
the lowest point on the y-axis.
Tags
CCSS.HSF-IF.C.7A
4.
MULTIPLE CHOICE QUESTION
1 min • 1 pt
Minimum is:
when points on a graph are connected.
when points on a graph are not connected.
the highest point on the y-axis.
the lowest point on the y-axis.
Tags
CCSS.HSF-IF.C.7D
5.
MULTIPLE CHOICE QUESTION
1 min • 1 pt

Is the graph positive or negative?
Positive
Negative
Tags
CCSS.HSF-IF.C.7A
6.
MULTIPLE CHOICE QUESTION
1 min • 1 pt

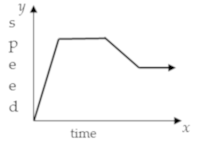
List the types of intervals that the graph demonstrates in order.
decreasing, constant, increasing, constant
increasing, decreasing, constant
increasing, constant, increasing, constant
increasing, constant, decreasing, constant
Tags
CCSS.HSF.IF.B.4
7.
MULTIPLE CHOICE QUESTION
1 min • 1 pt

When is this function increasing?
−2.5 < x < 2.5
0 < x < 5
0 < x < 55
−5 < x < 0
Create a free account and access millions of resources
Similar Resources on Wayground

13 questions
Features of Parabolas
Quiz
•
9th Grade - University

15 questions
Algebra 2 Semester Exam Review
Quiz
•
9th - 12th Grade

10 questions
Characteristics of Quadratic Functions
Quiz
•
10th - 12th Grade

10 questions
Quadratic Equations
Quiz
•
9th Grade

13 questions
Exam Review 3rd quarter
Quiz
•
9th Grade

14 questions
Graphing Quadratic Functions - Vertex Form
Quiz
•
9th - 11th Grade

15 questions
Transformations Quiz Review
Quiz
•
10th Grade

10 questions
Applications of Derivative Quiz #1
Quiz
•
12th Grade - Professi...
Popular Resources on Wayground

10 questions
Lab Safety Procedures and Guidelines
Interactive video
•
6th - 10th Grade

10 questions
Nouns, nouns, nouns
Quiz
•
3rd Grade

10 questions
9/11 Experience and Reflections
Interactive video
•
10th - 12th Grade

25 questions
Multiplication Facts
Quiz
•
5th Grade

11 questions
All about me
Quiz
•
Professional Development

22 questions
Adding Integers
Quiz
•
6th Grade

15 questions
Subtracting Integers
Quiz
•
7th Grade

9 questions
Tips & Tricks
Lesson
•
6th - 8th Grade
Discover more resources for Mathematics

12 questions
Graphing Inequalities on a Number Line
Quiz
•
9th Grade

15 questions
Two Step Equations
Quiz
•
9th Grade

12 questions
Absolute Value Equations
Quiz
•
9th Grade

15 questions
Combine Like Terms and Distributive Property
Quiz
•
8th - 9th Grade

20 questions
Transformations of Functions
Quiz
•
9th Grade

20 questions
Multi-Step Equations and Variables on Both Sides
Quiz
•
9th - 12th Grade

10 questions
Literal Equations
Quiz
•
9th Grade

10 questions
Solving Absolute Value Equations
Quiz
•
8th - 9th Grade


