
Domain Range Behavior Positive Negative Interval Notation
10th Grade
•14 Qs

Similar activities
CHAPTER 1: VARIATION
10th - 11th Grade
•15 Qs
Again, let's review your skills!
10th Grade
•10 Qs
Math competition
10th Grade
•10 Qs
Collecting and Analyzing Data
10th Grade - University
•12 Qs
Geometry
10th Grade
•15 Qs
Year 9 Self Evaluation Algebra 1
8th - 10th Grade
•12 Qs
Conversion Experience
4th Grade - University
•10 Qs

Domain Range Behavior Positive Negative Interval Notation
Quiz
•
Mathematics
•
10th Grade
•
Practice Problem
•
Hard
+2
Standards-aligned

Anthony Clark
FREE Resource
Enhance your content in a minute
14 questions
Show all answers
1.
MULTIPLE CHOICE QUESTION
1 min • 1 pt

Decreasing Interval
Increasing Interval
Constant Interval
Positive Interval
Negative Interval
2.
MULTIPLE CHOICE QUESTION
1 min • 1 pt

Decreasing Interval
Increasing Interval
Constant Interval
Positive Interval
Negative Interval
3.
MULTIPLE CHOICE QUESTION
1 min • 1 pt
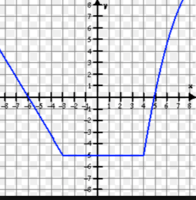
Over what interval is this function constant?
-5 < x < ∞
-3 < x < 4
4 < x < ∞
-5
Tags
CCSS.HSF-IF.C.7B
4.
MULTIPLE CHOICE QUESTION
1 min • 1 pt

Look at the Graph. Write the inequality in interval notation.
[-4, -1)
(-4, -1)
(-4, -1]
[-4, -1]
5.
MULTIPLE CHOICE QUESTION
1 min • 1 pt

Look at the picture. Which number line corresponds to [-2, 5]?
Graph 1
Graph 2
Graph 3
Graph 4
6.
MATCH QUESTION
1 min • 1 pt
Match the following.
Graph is going "downhill"
Constant Interval
Graph is a flat, horizontal line
Negative Interval
Graph is above the x-axis
Decreasing Interval
Graph is below the x-axis
Positive Interval
Graph is going "uphill"
Increasing Interval
7.
MULTIPLE CHOICE QUESTION
1 min • 1 pt

The graph of a linear function is given on the coordinate plane. Which inequality best represents the domain of the part shown?
Tags
CCSS.8.F.A.1
CCSS.HSF.IF.B.5


Access all questions and much more by creating a free account
Create resources
Host any resource
Get auto-graded reports
Continue with Google

Continue with Email
Continue with Classlink
Continue with Clever
or continue with
Microsoft
%20(1).png)
Apple
Others
Already have an account?
Similar Resources on Wayground
14 questions
Bell Work 2/24
Quiz
•
7th Grade - University
10 questions
CIRCLE 10
Quiz
•
10th Grade
15 questions
Quiz#4: Distance and Midpoint Formula
Quiz
•
10th Grade
10 questions
Measures of Position (Quartile)
Quiz
•
10th Grade
17 questions
Matrikulasi Final Test
Quiz
•
10th Grade
11 questions
rhombus and rectangles
Quiz
•
10th - 12th Grade
10 questions
Lesson 5:Tangent and Secant Segments-Quarter 2-Short Quiz
Quiz
•
9th - 10th Grade
11 questions
Geometry Unit 3 Review
Quiz
•
9th Grade - University
Popular Resources on Wayground
15 questions
Fractions on a Number Line
Quiz
•
3rd Grade
20 questions
Equivalent Fractions
Quiz
•
3rd Grade
25 questions
Multiplication Facts
Quiz
•
5th Grade
22 questions
fractions
Quiz
•
3rd Grade
20 questions
Main Idea and Details
Quiz
•
5th Grade
20 questions
Context Clues
Quiz
•
6th Grade
15 questions
Equivalent Fractions
Quiz
•
4th Grade
20 questions
Figurative Language Review
Quiz
•
6th Grade
Discover more resources for Mathematics
25 questions
Complementary and Supplementary Angles
Quiz
•
7th - 10th Grade
12 questions
Add and Subtract Polynomials
Quiz
•
9th - 12th Grade
13 questions
Model Exponential Growth and Decay Scenarios
Quiz
•
9th - 12th Grade
27 questions
7.2.3 Quadrilateral Properties
Quiz
•
9th - 12th Grade
16 questions
Converting Improper Fractions to Mixed Numbers
Quiz
•
4th - 10th Grade
10 questions
Simplifying Expressions by Combining Like Terms
Interactive video
•
6th - 10th Grade
10 questions
Simplifying Expressions with the Distributive Property
Interactive video
•
6th - 10th Grade
10 questions
Key Features of Quadratic Functions
Interactive video
•
8th - 12th Grade