Tables Functions Not Functions
Quiz
•
Mathematics
•
8th Grade
•
Practice Problem
•
Hard
+4
Standards-aligned

Anthony Clark
FREE Resource
Enhance your content in a minute
10 questions
Show all answers
1.
MULTIPLE CHOICE QUESTION
1 min • 1 pt

Using the rule y=6x
which two numbers complete the table?
63, 84
48, 72
60, 78
54, 72
Tags
CCSS.5.OA.B.3
2.
MULTIPLE CHOICE QUESTION
1 min • 1 pt

What is the equation to represent the table?
y=3x+1
y=4x-2
y=x+1
y=x+7
Tags
CCSS.8.F.B.4
CCSS.HSF.LE.A.2
3.
MULTIPLE CHOICE QUESTION
1 min • 1 pt
An elephant weighs 200 pounds at birth and gains approximately 2 pounds per day. The function w = 2d + 200 represents the weight, w, of an elephant on any given day, d, during his first year. What types of numbers are appropriate input (d) values for the situation?
positive numbers only
negative numbers only
positive numbers and zero
zero only
negative numbers and zero
Tags
CCSS.8.F.A.1
CCSS.HSF.IF.A.1
4.
MULTIPLE CHOICE QUESTION
1 min • 1 pt

Which graph represents the table?


Tags
CCSS.8.EE.B.5
5.
MULTIPLE CHOICE QUESTION
1 min • 1 pt

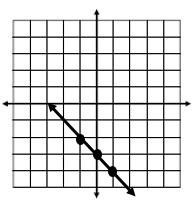
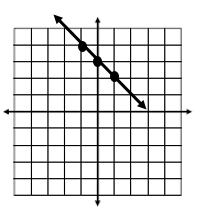
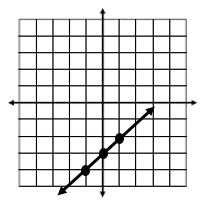
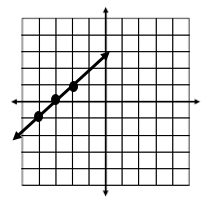
Which graph matches the table?
A
B
C
D
6.
MULTIPLE CHOICE QUESTION
1 min • 1 pt

Erasers cost 5 cents each at the school store. The table shows this relationship. Choose the graph which displays the ordered pairs and describes the graph.


Tags
CCSS.8.EE.B.5
7.
MULTIPLE CHOICE QUESTION
1 min • 1 pt

What is the rule in this table?
Multiply the number of days by 7 and add 1
Add 7 to the number of days
Multiply the number of days by 4 and add 4
Add 13 to the number of days
Tags
CCSS.8.F.A.1
CCSS.HSF.IF.A.1
Access all questions and much more by creating a free account
Create resources
Host any resource
Get auto-graded reports

Continue with Google

Continue with Email

Continue with Classlink

Continue with Clever
or continue with

Microsoft
%20(1).png)
Apple
Others
Already have an account?
Similar Resources on Wayground

15 questions
linear function properties
Quiz
•
8th Grade

12 questions
A2 S2 Graph Review
Quiz
•
9th - 12th Grade

10 questions
8.6C, 8.7CD - Pythagorean Theorem
Quiz
•
8th Grade

15 questions
Limit Theorems
Quiz
•
11th Grade

10 questions
Review Rational and Irrational Numbers
Quiz
•
8th Grade

10 questions
Nat5 Compound Interest
Quiz
•
9th - 12th Grade

12 questions
Closure and Commutative Property of Integers
Quiz
•
6th - 8th Grade

14 questions
Alg. CH 5 Terms
Quiz
•
9th Grade
Popular Resources on Wayground

15 questions
Fractions on a Number Line
Quiz
•
3rd Grade

20 questions
Equivalent Fractions
Quiz
•
3rd Grade

25 questions
Multiplication Facts
Quiz
•
5th Grade

54 questions
Analyzing Line Graphs & Tables
Quiz
•
4th Grade

22 questions
fractions
Quiz
•
3rd Grade

20 questions
Main Idea and Details
Quiz
•
5th Grade

20 questions
Context Clues
Quiz
•
6th Grade

15 questions
Equivalent Fractions
Quiz
•
4th Grade
Discover more resources for Mathematics

14 questions
finding slope from a graph
Quiz
•
8th Grade

20 questions
Laws of Exponents
Quiz
•
8th Grade

12 questions
8th U5L9 Linear Models
Quiz
•
8th Grade

20 questions
Graphing Inequalities on a Number Line
Quiz
•
6th - 9th Grade

20 questions
Volume of cylinders, Cones and Spheres
Quiz
•
8th Grade

20 questions
One Step equations addition and subtraction
Quiz
•
5th - 8th Grade

20 questions
Mean, Median, Mode, and Range
Quiz
•
8th Grade

15 questions
Volume of a Cylinder
Quiz
•
8th Grade


