Graph of Equivalent Ratios
Authored by Anthony Clark
Mathematics
6th Grade
CCSS covered

AI Actions
Add similar questions
Adjust reading levels
Convert to real-world scenario
Translate activity
More...
Content View
Student View
7 questions
Show all answers
1.
MULTIPLE CHOICE QUESTION
1 min • 1 pt
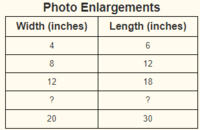
A photographer posted a photo-enlargement chart on the wall, as shown below.
According to the pattern, what width and length are missing from the chart?
13 inch width, 19 inch length
14 inch width, 20 inch length
16 inch width, 24 inch length
18 inch width, 24 inch length
2.
MULTIPLE CHOICE QUESTION
1 min • 1 pt

Enrique is making cakes.
Based on the table, how many eggs will Enrique need to make 7 cakes?
11
28
32
40
Tags
CCSS.4.OA.C.5
3.
MULTIPLE CHOICE QUESTION
1 min • 1 pt
Which graph represents a proportional relationship?


Tags
CCSS.7.RP.A.2D
4.
MULTIPLE CHOICE QUESTION
1 min • 1 pt

For every 2 minutes Kiara runs, she then walks for 20. Choose the graph that represents the ratio table.


Tags
CCSS.7.RP.A.2D
5.
OPEN ENDED QUESTION
1 min • 1 pt

Enter your answers below separated by a comma.
Evaluate responses using AI:
OFF
Tags
CCSS.7.RP.A.2D
6.
MULTIPLE CHOICE QUESTION
1 min • 1 pt

Which graph is proportional?
A
B
C and D
All of the graphs are proportional
Tags
CCSS.7.RP.A.2D
7.
MULTIPLE CHOICE QUESTION
1 min • 1 pt

Which of the following statements can be used to create the graph shown?
For every 5 hours of work you get $6
For every 24 hours of work you get $10
For every 36 hours of work you get $50
For every 6 hours of work you get $5
Tags
CCSS.7.RP.A.2D
Access all questions and much more by creating a free account
Create resources
Host any resource
Get auto-graded reports
Continue with Google

Continue with Email
Continue with Classlink
Continue with Clever
or continue with
Microsoft
%20(1).png)
Apple
Others
Already have an account?
