Decimal Probability Based on Table of Results
Quiz
•
Mathematics
•
7th Grade
•
Hard

Anthony Clark
FREE Resource
20 questions
Show all answers
1.
MULTIPLE CHOICE QUESTION
1 min • 1 pt

Based on the chart, what is the experimental probability of pulling a green marble?
12.5%
32%
8%
80%
2.
MULTIPLE CHOICE QUESTION
1 min • 1 pt

Andrew picks one marble at a time from a box and replaces it. He repeats this process 25 times and records the results in the table. Based on the table, which color marble has an experimental probability of 1/5?
Yellow
Red
Blue
Green
3.
MULTIPLE CHOICE QUESTION
1 min • 10 pts
A likely chance event is closer to what number?
0
1
.5
100
4.
MULTIPLE CHOICE QUESTION
1 min • 1 pt

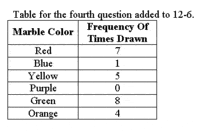
The chart below represents the number of marbles in a jar.
P(green) =
5/19
1/5
5/14
5.
MULTIPLE CHOICE QUESTION
1 min • 1 pt

The table shows the numbers of boys and girls that are enrolled in Spanish, French, or German class. If a student is chosen at random, what is the probability that the student is in Spanish or is a boy?
.20
.40
.70
.90
6.
MULTIPLE CHOICE QUESTION
1 min • 1 pt

A factory makes cars. The table shows the estimated probabilities the factory makes 1, 2, or 3 defective cars on any given day.
What is the probability the factory makes less than 2 defective cars per day?
0.22
0.31
0.47
0.78
7.
MULTIPLE CHOICE QUESTION
1 min • 1 pt

Use the table of probabilities to find P(D).
0.4
0.3
0.2
0.1
Create a free account and access millions of resources
Similar Resources on Wayground

20 questions
Experimental Probability (OK7)
Quiz
•
7th - 9th Grade

25 questions
Simple Probability
Quiz
•
7th Grade

15 questions
Interpreting Two Way Tables and Probability
Quiz
•
8th Grade - University

18 questions
Theoretical & Experimental Probability
Quiz
•
9th - 12th Grade

15 questions
Probability Using Two Way Table
Quiz
•
8th Grade - University

15 questions
Probability Experimental and Theoretical
Quiz
•
7th Grade

20 questions
Unit 10.1-10.3 Probability Review
Quiz
•
6th - 7th Grade

20 questions
Probability Review
Quiz
•
7th Grade
Popular Resources on Wayground

10 questions
Lab Safety Procedures and Guidelines
Interactive video
•
6th - 10th Grade

10 questions
Nouns, nouns, nouns
Quiz
•
3rd Grade

10 questions
9/11 Experience and Reflections
Interactive video
•
10th - 12th Grade

25 questions
Multiplication Facts
Quiz
•
5th Grade

11 questions
All about me
Quiz
•
Professional Development

22 questions
Adding Integers
Quiz
•
6th Grade

15 questions
Subtracting Integers
Quiz
•
7th Grade

9 questions
Tips & Tricks
Lesson
•
6th - 8th Grade
Discover more resources for Mathematics

15 questions
Subtracting Integers
Quiz
•
7th Grade

20 questions
Multiplying and Dividing Integers
Quiz
•
7th Grade

20 questions
Perfect Squares and Square Roots
Quiz
•
7th Grade

20 questions
Adding and Subtracting integers
Quiz
•
7th Grade

20 questions
Adding and Subtracting Integers
Quiz
•
6th - 7th Grade

20 questions
Complementary and Supplementary Angles
Quiz
•
7th Grade

20 questions
Adding Integers
Quiz
•
6th - 8th Grade

25 questions
Perfect Squares and Square Roots 1
Quiz
•
7th Grade


