Solving/Interpreting Linear Inequalities in Two Variables
Authored by Anthony Clark
Mathematics
9th Grade
CCSS covered
Used 1+ times

AI Actions
Add similar questions
Adjust reading levels
Convert to real-world scenario
Translate activity
More...
Content View
Student View
15 questions
Show all answers
1.
MULTIPLE CHOICE QUESTION
1 min • 5 pts

Choose the correct inequality for this graph.
Tags
CCSS.HSA.REI.D.12
2.
MULTIPLE CHOICE QUESTION
1 min • 5 pts
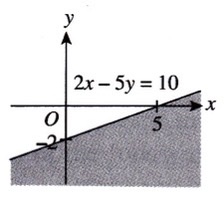
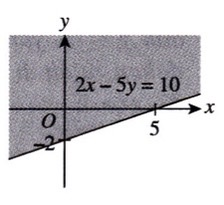
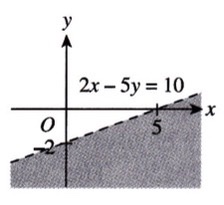
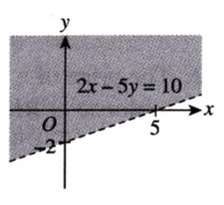
Which shaded region in the diagram is defined by the linear inequality 2x - 5y < 10 ?
Tags
CCSS.HSA.REI.D.12
3.
MULTIPLE CHOICE QUESTION
1 min • 5 pts

Write the inequality
y>2/3x-3
y<2/3x-3
y≤2/3x-3
y≥2/3x-3
Tags
CCSS.HSA.REI.D.12
4.
MULTIPLE CHOICE QUESTION
1 min • 5 pts

Write the inequalities
x≤-2
y≤x-3
y≤-2
y≤x-3
x≥-2
y≤x-3
y≥-2
y≤x-3
Tags
CCSS.HSA.REI.D.12
5.
MULTIPLE SELECT QUESTION
1 min • 5 pts

Identify the two inequalities that represents the graph.
y > ½x - 3
y ≤ -4x + 2
y < ½x - 3
y ≥ -4x + 2
Tags
CCSS.HSA.REI.D.12
6.
MULTIPLE CHOICE QUESTION
1 min • 5 pts

Diagram 2 shows two straight lines on a Cartesian plane. Which of the following regions define linear inequalities
y ≤ x + 5 and y ≥ 2 − x?
I
II
III
IV
Tags
CCSS.HSA.REI.D.12
7.
MULTIPLE CHOICE QUESTION
1 min • 5 pts

The diagram shows a shaded region that satisfies three inequalities. State an inequality other than x < 4 and y ≥ −x.
x ≤ o
x ≥ 0
y ≤ 0
y ≥ 0
Tags
CCSS.HSA.REI.D.12


Access all questions and much more by creating a free account
Create resources
Host any resource
Get auto-graded reports
Continue with Google

Continue with Email
Continue with Classlink
Continue with Clever
or continue with
Microsoft
%20(1).png)
Apple
Others
Already have an account?
Similar Resources on Wayground

10 questions
Revisão 5°ano ETAPA 1
Quiz
•
12th Grade
20 questions
Biostatistics quiz #1
Quiz
•
University
15 questions
INTEGRALES DE POLINOMIOS
Quiz
•
12th Grade
10 questions
Zenbaki konplexuak_3_Eragiketak
Quiz
•
11th Grade
15 questions
StatProb Lesson 4 Quiz Reviewer (SY 23 - 24)
Quiz
•
11th Grade
20 questions
Indices-(O'Level Revision)
Quiz
•
8th - 10th Grade
10 questions
Nombres relatifs (niveau 1)
Quiz
•
8th - 9th Grade
13 questions
FUNÇÃO DO 1º E 2º GRAU
Quiz
•
10th - 11th Grade
Popular Resources on Wayground
7 questions
History of Valentine's Day
Interactive video
•
4th Grade
15 questions
Fractions on a Number Line
Quiz
•
3rd Grade
20 questions
Equivalent Fractions
Quiz
•
3rd Grade
25 questions
Multiplication Facts
Quiz
•
5th Grade
22 questions
fractions
Quiz
•
3rd Grade
15 questions
Valentine's Day Trivia
Quiz
•
3rd Grade
20 questions
Main Idea and Details
Quiz
•
5th Grade
20 questions
Context Clues
Quiz
•
6th Grade
Discover more resources for Mathematics
20 questions
Graphing Inequalities on a Number Line
Quiz
•
6th - 9th Grade
20 questions
Exponent Properties
Quiz
•
9th Grade
15 questions
Combine Like Terms and Distributive Property
Quiz
•
8th - 9th Grade
20 questions
Function or Not a Function
Quiz
•
8th - 9th Grade
10 questions
Factor Quadratic Expressions with Various Coefficients
Quiz
•
9th - 12th Grade
10 questions
Elijah McCoy: Innovations and Impact in Black History
Interactive video
•
6th - 10th Grade
21 questions
Factoring Trinomials (a=1)
Quiz
•
9th Grade
5 questions
Triangle Congruence Theorems
Interactive video
•
9th - 12th Grade