
Graph Unit Rate
8th Grade
•15 Qs

Similar activities
Maths quiz
8th Grade
•11 Qs
Quiz 2 First Order DE
University
•10 Qs
Quiz on Commission and Salaries & Wages
12th Grade
•20 Qs
hypothesis testing
11th - 12th Grade
•16 Qs
NATIONAL MATHEMATICS DAY
5th Grade - Professional Development
•10 Qs
LP2; Week 1 - A/R Guide
9th Grade
•20 Qs
Quiz 2
8th Grade
•20 Qs
Ratios
8th Grade
•10 Qs

Graph Unit Rate
Quiz
•
Mathematics
•
8th Grade
•
Practice Problem
•
Hard
+4
Standards-aligned

Anthony Clark
FREE Resource
Enhance your content in a minute
15 questions
Show all answers
1.
MULTIPLE CHOICE QUESTION
1 min • 5 pts

Sia saves 25 dollar per month. Miguel's savings are shown in the graph. After two months, how much more would Sia have saved than Miguel?
$10
$20
$30
$40
Tags
CCSS.8.F.A.2
CCSS.HSF.IF.C.9
2.
MULTIPLE CHOICE QUESTION
1 min • 5 pts

The graph shows the speed of Sally the sloth. How long would it take Sally to travel 9 feet?
30 seconds
One minute
A minute and a half
Two minutes
Tags
CCSS.8.EE.B.5
3.
MULTIPLE CHOICE QUESTION
1 min • 1 pt

Which statement is the correct unit rate?
5 seconds per foot
5 feet per second
2.5 seconds per foot
2.5 feet per second
Tags
CCSS.7.RP.A.2D
4.
MULTIPLE CHOICE QUESTION
1 min • 1 pt
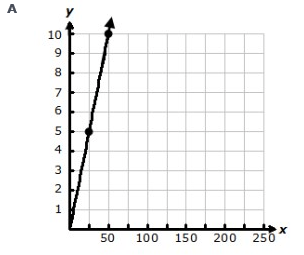
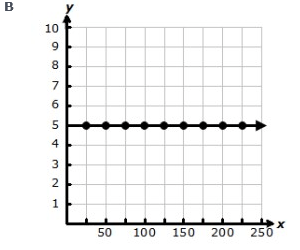
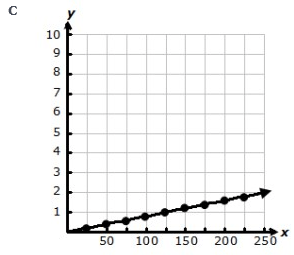
A bus travels 25 miles in 30 minutes. Which graph has a slope that best represents the number of miles per minute the bus travels?


Tags
CCSS.8.EE.B.5
5.
MULTIPLE CHOICE QUESTION
1 min • 1 pt
For every 125 pages Daysha reads, she earns 5 points. Which graph models this relationship?

Tags
CCSS.8.EE.B.5
6.
MULTIPLE CHOICE QUESTION
1 min • 1 pt

Which statement best describes the unit rate?
50 cm per second
300 cm per second
1 cm per second
25 cm per second
Tags
CCSS.7.RP.A.2D
7.
MULTIPLE CHOICE QUESTION
1 min • 1 pt
A student traveled a distance of 68 miles in 136 minutes. Which graph has a slope that best represents this rate?


Tags
CCSS.8.EE.B.5


Access all questions and much more by creating a free account
Create resources
Host any resource
Get auto-graded reports
Continue with Google

Continue with Email
Continue with Classlink
Continue with Clever
or continue with
Microsoft
%20(1).png)
Apple
Others
Already have an account?
Similar Resources on Wayground
20 questions
Conversion Metric to Metric
Quiz
•
7th Grade - University
17 questions
Reviewer for Final Exam
Quiz
•
10th Grade
12 questions
surface area and volume of prisms
Quiz
•
8th - 12th Grade
10 questions
Hypothesis Testing
Quiz
•
11th Grade
15 questions
Standard Form
Quiz
•
9th Grade
10 questions
HINGES THEOREM
Quiz
•
8th Grade
10 questions
Basic Trigonometric Identities
Quiz
•
10th - 11th Grade
10 questions
Lògica
Quiz
•
10th Grade
Popular Resources on Wayground
15 questions
Fractions on a Number Line
Quiz
•
3rd Grade
20 questions
Equivalent Fractions
Quiz
•
3rd Grade
25 questions
Multiplication Facts
Quiz
•
5th Grade
22 questions
fractions
Quiz
•
3rd Grade
20 questions
Main Idea and Details
Quiz
•
5th Grade
20 questions
Context Clues
Quiz
•
6th Grade
15 questions
Equivalent Fractions
Quiz
•
4th Grade
20 questions
Figurative Language Review
Quiz
•
6th Grade
Discover more resources for Mathematics
15 questions
Product of Powers Property A1 U7
Quiz
•
8th Grade
20 questions
Laws of Exponents
Quiz
•
8th Grade
16 questions
8th U5L5 Graphs of Functions
Quiz
•
8th Grade
20 questions
Graphing Inequalities on a Number Line
Quiz
•
6th - 9th Grade
20 questions
Exponent Rules Review
Quiz
•
8th - 9th Grade
20 questions
One Step equations addition and subtraction
Quiz
•
5th - 8th Grade
20 questions
Translations
Quiz
•
8th Grade
25 questions
Complementary and Supplementary Angles
Quiz
•
7th - 10th Grade