bar and pic graph 2
Quiz
•
Mathematics
•
3rd Grade
•
Medium
Heba Fessal
Used 2+ times
FREE Resource
17 questions
Show all answers
1.
MULTIPLE CHOICE QUESTION
3 mins • 1 pt

2.
MULTIPLE CHOICE QUESTION
1 min • 1 pt

The bar graph shows the number of hamburgers sold at Bob’s Burger Shack. On which days were more than 80 hamburgers sold?
Wednesday and Friday
Tuesday and Thursday
Monday, Tuesday, and Thursday
Tuesday, Wednesday, Thursday, and Friday
3.
MULTIPLE CHOICE QUESTION
1 min • 1 pt

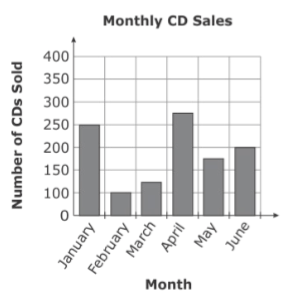
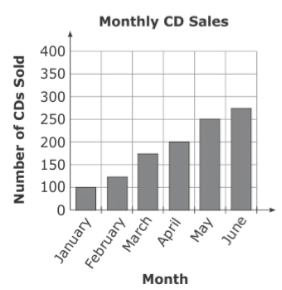
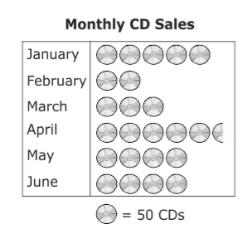
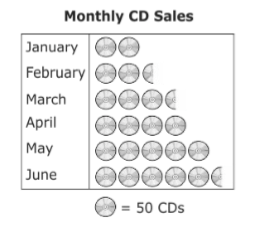
In the chart , a music store listed the number of CDs sold each month for 6 months. Which graph correctly represents the information in the chart?


4.
MULTIPLE CHOICE QUESTION
1 min • 1 pt

In the chart , a music store listed the number of CDs sold each month for 6 months. Which graph correctly represents the information in the chart?


5.
MULTIPLE CHOICE QUESTION
30 sec • 1 pt

6.
MULTIPLE CHOICE QUESTION
30 sec • 1 pt

7.
MULTIPLE CHOICE QUESTION
3 mins • 1 pt

Create a free account and access millions of resources
Similar Resources on Wayground

20 questions
Data Analysis
Quiz
•
3rd Grade

20 questions
data handling
Quiz
•
3rd Grade

18 questions
Data Sets
Quiz
•
3rd - 5th Grade

21 questions
Data and Measurement
Quiz
•
3rd - 5th Grade

17 questions
Interpreting Data
Quiz
•
KG - 12th Grade

21 questions
Yr.3 Statistics and Data Review
Quiz
•
3rd Grade

12 questions
grade 3
Quiz
•
3rd Grade

20 questions
Pictogram and Bar Chart
Quiz
•
3rd - 6th Grade
Popular Resources on Wayground

50 questions
Trivia 7/25
Quiz
•
12th Grade

11 questions
Standard Response Protocol
Quiz
•
6th - 8th Grade

11 questions
Negative Exponents
Quiz
•
7th - 8th Grade

12 questions
Exponent Expressions
Quiz
•
6th Grade

4 questions
Exit Ticket 7/29
Quiz
•
8th Grade

20 questions
Subject-Verb Agreement
Quiz
•
9th Grade

20 questions
One Step Equations All Operations
Quiz
•
6th - 7th Grade

18 questions
"A Quilt of a Country"
Quiz
•
9th Grade


