Geographic Data and Google Sheets
Interactive Video
•
Computers
•
6th - 8th Grade
•
Practice Problem
•
Hard

Patricia Brown
FREE Resource
Read more
10 questions
Show all answers
1.
MULTIPLE CHOICE QUESTION
30 sec • 1 pt
What is the latitude and longitude of Catskill, New York, as mentioned in the video?
42.2° N, 73.7° W
40.7° N, 74.0° W
43.0° N, 75.0° W
41.5° N, 74.0° W
2.
MULTIPLE CHOICE QUESTION
30 sec • 1 pt
Which website is recommended for finding sunrise and sunset data?
Sunrise-sunset.org
Google.com
Timeanddate.com
Weather.com
3.
MULTIPLE CHOICE QUESTION
30 sec • 1 pt
What is the correct way to enter sunset time to ensure it shows PM in Google Sheets?
Enter the time as AM and manually change it to PM
Use a 24-hour clock format
Enter the time and hope it auto-corrects
Type 'PM' after the time
4.
MULTIPLE CHOICE QUESTION
30 sec • 1 pt
What is the daylight duration for December 21st, 2020, in Catskill, New York?
7 hours and 30 minutes
10 hours and 15 minutes
9 hours and 5 minutes
8 hours and 45 minutes
5.
MULTIPLE CHOICE QUESTION
30 sec • 1 pt
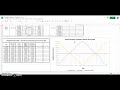
What colors represent the data lines for Russia, Ecuador, and Antarctica on the graph?
Yellow, Green, Blue
Orange, Red, Blue
Blue, Red, Yellow-Orange
Red, Blue, Green
6.
MULTIPLE CHOICE QUESTION
30 sec • 1 pt
What is the purpose of adding more lines to the graph?
To practice using Google Sheets
To compare daylight durations of different locations
To fill up the graph space
To make the graph look more colorful
7.
MULTIPLE CHOICE QUESTION
30 sec • 1 pt
How can you change the color of a data line on the graph?
By using a color picker tool
By changing the color in the data table
By editing the chart and customizing the series
By clicking on the line and selecting a new color
Access all questions and much more by creating a free account
Create resources
Host any resource
Get auto-graded reports
Continue with Google

Continue with Email
Continue with Classlink
Continue with Clever
or continue with
Microsoft
%20(1).png)
Apple
Others
Already have an account?
Popular Resources on Wayground

15 questions
Fractions on a Number Line
Quiz
•
3rd Grade
20 questions
Equivalent Fractions
Quiz
•
3rd Grade
25 questions
Multiplication Facts
Quiz
•
5th Grade
54 questions
Analyzing Line Graphs & Tables
Quiz
•
4th Grade
22 questions
fractions
Quiz
•
3rd Grade
20 questions
Main Idea and Details
Quiz
•
5th Grade
20 questions
Context Clues
Quiz
•
6th Grade
15 questions
Equivalent Fractions
Quiz
•
4th Grade