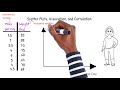
Correlation and Causation Concepts
Interactive Video
•
Mathematics
•
9th - 10th Grade
•
Practice Problem
•
Hard

Thomas White
FREE Resource
Read more
10 questions
Show all answers
1.
MULTIPLE CHOICE QUESTION
30 sec • 1 pt
What is the main focus of the video tutorial?
Understanding bar charts
Learning about scatter plots, association, and correlation
Exploring pie charts
Studying line graphs
2.
MULTIPLE CHOICE QUESTION
30 sec • 1 pt
In the survey example, what are the two variables being tracked?
Height and age
Hours slept and mood
Number of steps and calories
Miles walked and weight
3.
MULTIPLE CHOICE QUESTION
30 sec • 1 pt
What is the purpose of a scatter plot?
To identify relationships between two quantitative variables
To compare parts of a whole
To display categorical data
To show trends over time
4.
MULTIPLE CHOICE QUESTION
30 sec • 1 pt
Which variable is placed on the x-axis in a scatter plot?
Dependent variable
Explanatory variable
Categorical variable
Response variable
5.
MULTIPLE CHOICE QUESTION
30 sec • 1 pt
What does it mean if points on a scatter plot form a line?
There is a potential association between variables
The data is incorrect
The variables are categorical
There is no relationship between variables
6.
MULTIPLE CHOICE QUESTION
30 sec • 1 pt
Why is it important to distinguish between correlation and causation?
To simplify data analysis
To make graphs more colorful
To avoid incorrect assumptions about relationships
To ensure data is plotted correctly
7.
MULTIPLE CHOICE QUESTION
30 sec • 1 pt
What type of correlation is present if as x increases, y decreases?
Positive linear correlation
No correlation
Negative linear correlation
Circular correlation
Access all questions and much more by creating a free account
Create resources
Host any resource
Get auto-graded reports
Continue with Google

Continue with Email
Continue with Classlink
Continue with Clever
or continue with
Microsoft
%20(1).png)
Apple
Others
Already have an account?
Similar Resources on Wayground

7 questions
APPC 1.2 video check
Interactive video
•
9th Grade - University
2 questions
GCSE Secondary Maths Age 13-17 - Geometry & Measures: Circle Theorems - Explained
Interactive video
•
10th - 12th Grade
6 questions
Armistice Day Service at the National Memorial Arboretum
Interactive video
•
9th - 10th Grade
6 questions
CLEAN : Dutch euthanasia doctor acquitted in landmark case
Interactive video
•
9th - 10th Grade
11 questions
Solving Linear Equations with Fractions
Interactive video
•
7th - 10th Grade
2 questions
CLEAN : SDF says close to defeating last IS fighters in Raqa
Interactive video
•
9th - 10th Grade
Popular Resources on Wayground
15 questions
Fractions on a Number Line
Quiz
•
3rd Grade
20 questions
Equivalent Fractions
Quiz
•
3rd Grade
25 questions
Multiplication Facts
Quiz
•
5th Grade
22 questions
fractions
Quiz
•
3rd Grade
20 questions
Main Idea and Details
Quiz
•
5th Grade
20 questions
Context Clues
Quiz
•
6th Grade
15 questions
Equivalent Fractions
Quiz
•
4th Grade
20 questions
Figurative Language Review
Quiz
•
6th Grade
Discover more resources for Mathematics
20 questions
Graphing Inequalities on a Number Line
Quiz
•
6th - 9th Grade
12 questions
Exponential Growth and Decay
Quiz
•
9th Grade
20 questions
Exponent Rules Review
Quiz
•
8th - 9th Grade
25 questions
Complementary and Supplementary Angles
Quiz
•
7th - 10th Grade
12 questions
Add and Subtract Polynomials
Quiz
•
9th - 12th Grade
13 questions
Model Exponential Growth and Decay Scenarios
Quiz
•
9th - 12th Grade
15 questions
Combine Like Terms and Distributive Property
Quiz
•
8th - 9th Grade
27 questions
7.2.3 Quadrilateral Properties
Quiz
•
9th - 12th Grade