Understanding Venn Diagrams and Data
Interactive Video
•
Mathematics
•
3rd - 4th Grade
•
Practice Problem
•
Hard

Thomas White
FREE Resource
Read more
10 questions
Show all answers
1.
MULTIPLE CHOICE QUESTION
30 sec • 1 pt
What is the primary purpose of using Venn diagrams?
To solve mathematical equations
To create artistic designs
To represent and understand data
To write stories
2.
MULTIPLE CHOICE QUESTION
30 sec • 1 pt
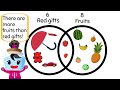
Why did Ivan's mom buy him red gifts and fruits?
Because Ivan loves red and fruits
Because they are expensive
Because they are easy to find
Because they were on sale
3.
MULTIPLE CHOICE QUESTION
30 sec • 1 pt
What does the overlapping section in a Venn diagram represent?
Items that are irrelevant
Items that are outside the categories
Items that belong to neither category
Items that belong to both categories
4.
MULTIPLE CHOICE QUESTION
30 sec • 1 pt
In the context of Venn diagrams, what is 'data'?
A type of fruit
Any item or object to be recorded
A type of gift
A mathematical formula
5.
MULTIPLE CHOICE QUESTION
30 sec • 1 pt
How can Venn diagrams help in understanding data?
By visually showing relationships between data sets
By listing data in a linear fashion
By making data look colorful
By hiding data
6.
MULTIPLE CHOICE QUESTION
30 sec • 1 pt
How many red gifts did Ivan receive?
5
4
7
6
7.
MULTIPLE CHOICE QUESTION
30 sec • 1 pt
How many fruits did Ivan's mom buy?
8
7
6
5
Access all questions and much more by creating a free account
Create resources
Host any resource
Get auto-graded reports
Continue with Google

Continue with Email
Continue with Classlink
Continue with Clever
or continue with
Microsoft
%20(1).png)
Apple
Others
Already have an account?
