Data Analysis and Interpretation Concepts
Interactive Video
•
Physics
•
9th - 10th Grade
•
Practice Problem
•
Hard

Lucas Foster
FREE Resource
Read more
10 questions
Show all answers
1.
MULTIPLE CHOICE QUESTION
30 sec • 1 pt
What does 'bivariate' mean in the context of data analysis?
Data with no variables
Data with three variables
Data with two variables
Data with one variable
2.
MULTIPLE CHOICE QUESTION
30 sec • 1 pt
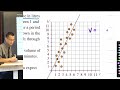
In Yusuf's experiment, what was being measured?
The pressure of water
The temperature of water
The volume of water in liters
The speed of water flow
3.
MULTIPLE CHOICE QUESTION
30 sec • 1 pt
What is interpolation in the context of data analysis?
Predicting data points outside the range
Predicting data points within the range
Removing outliers from data
Ignoring data points
4.
MULTIPLE CHOICE QUESTION
30 sec • 1 pt
What is the purpose of a confidence interval in data analysis?
To eliminate errors in data
To provide a range of values within which a data point is expected to lie
To determine the exact value of a data point
To increase the precision of measurements
5.
MULTIPLE CHOICE QUESTION
30 sec • 1 pt
What is the equation form used to represent the line of best fit in this experiment?
v = 2t + 0
y = 2x + 0
v = mt + b
y = mx + b
6.
MULTIPLE CHOICE QUESTION
30 sec • 1 pt
Why is the intercept of the line of best fit zero in this experiment?
Because no water flows with no time
Because the experiment was conducted incorrectly
Because the data was manipulated
Because the graph was drawn inaccurately
7.
MULTIPLE CHOICE QUESTION
30 sec • 1 pt
What does the gradient of the line of best fit represent in this experiment?
The speed of water flow
The time taken for water to flow
The total volume of water
The rate of water flow in liters per minute
Access all questions and much more by creating a free account
Create resources
Host any resource
Get auto-graded reports
Continue with Google

Continue with Email
Continue with Classlink
Continue with Clever
or continue with
Microsoft
%20(1).png)
Apple
Others
Already have an account?
Popular Resources on Wayground

15 questions
Fractions on a Number Line
Quiz
•
3rd Grade
20 questions
Equivalent Fractions
Quiz
•
3rd Grade
25 questions
Multiplication Facts
Quiz
•
5th Grade
22 questions
fractions
Quiz
•
3rd Grade
20 questions
Main Idea and Details
Quiz
•
5th Grade
20 questions
Context Clues
Quiz
•
6th Grade
15 questions
Equivalent Fractions
Quiz
•
4th Grade
20 questions
Figurative Language Review
Quiz
•
6th Grade
Discover more resources for Physics
37 questions
Electricity Review
Quiz
•
9th Grade
10 questions
Exit Check 2.4 - 2nd Law Graphs
Quiz
•
9th Grade
10 questions
Exit Check 2.2 - 3rd Law
Quiz
•
9th Grade
10 questions
Exit Check 2.3 - 2nd Law
Quiz
•
9th Grade
10 questions
Exit Check 2.1 - 1st Law
Quiz
•
9th Grade
20 questions
Potential and Kinetic Energy
Quiz
•
9th - 12th Grade
34 questions
Energy Review
Quiz
•
9th - 12th Grade
10 questions
Energy Transformations
Quiz
•
9th Grade