Exponential and Logarithmic Functions Concepts
Interactive Video
•
Mathematics
•
9th - 10th Grade
•
Practice Problem
•
Hard

Lucas Foster
FREE Resource
Read more
10 questions
Show all answers
1.
MULTIPLE CHOICE QUESTION
30 sec • 1 pt
Why are exponential and logarithmic functions particularly relevant in today's world?
They are used in ancient history studies.
They are essential for designing clothes.
They help in understanding population growth and emergency responses.
They are used in cooking recipes.
2.
MULTIPLE CHOICE QUESTION
30 sec • 1 pt
What is a key characteristic of exponential functions?
They grow faster as they get larger.
They grow slower as they get larger.
They decrease in value over time.
They remain constant over time.
3.
MULTIPLE CHOICE QUESTION
30 sec • 1 pt
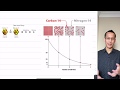
How does carbon-14 dating illustrate exponential decay?
Carbon-14 transforms into oxygen.
The rate of decay decreases as the amount of carbon-14 decreases.
The rate of decay is constant regardless of the amount.
Carbon-14 increases over time.
4.
MULTIPLE CHOICE QUESTION
30 sec • 1 pt
What are the four key features to look for when graphing exponential and logarithmic functions?
Asymptote, slope, color, and size.
Intercept, slope, color, and texture.
Color, size, shape, and texture.
Shape, intercept, asymptote, and point for scale.
5.
MULTIPLE CHOICE QUESTION
30 sec • 1 pt
What is the significance of the intercept in an exponential graph?
It shows where the graph touches the x-axis.
It indicates the starting point of the graph on the y-axis.
It determines the color of the graph.
It is irrelevant to the graph.
6.
MULTIPLE CHOICE QUESTION
30 sec • 1 pt
Why is it important to mark the asymptote on a graph?
It is used to calculate the area under the curve.
It helps in determining the color of the graph.
It shows the boundary that the graph approaches but never touches.
It indicates the highest point of the graph.
7.
MULTIPLE CHOICE QUESTION
30 sec • 1 pt
What is a 'point for scale' in graphing?
A point that is irrelevant to the graph.
A point that shows the highest value on the graph.
A reference point to ensure the graph is drawn to scale.
A point that determines the color of the graph.
Access all questions and much more by creating a free account
Create resources
Host any resource
Get auto-graded reports
Continue with Google

Continue with Email
Continue with Classlink
Continue with Clever
or continue with
Microsoft
%20(1).png)
Apple
Others
Already have an account?
Popular Resources on Wayground

15 questions
Fractions on a Number Line
Quiz
•
3rd Grade
10 questions
Probability Practice
Quiz
•
4th Grade
15 questions
Probability on Number LIne
Quiz
•
4th Grade
20 questions
Equivalent Fractions
Quiz
•
3rd Grade
25 questions
Multiplication Facts
Quiz
•
5th Grade
22 questions
fractions
Quiz
•
3rd Grade
6 questions
Appropriate Chromebook Usage
Lesson
•
7th Grade
10 questions
Greek Bases tele and phon
Quiz
•
6th - 8th Grade
Discover more resources for Mathematics
23 questions
TSI Math Vocabulary
Quiz
•
10th - 12th Grade
15 questions
Graphing Inequalities
Quiz
•
7th - 9th Grade
20 questions
Graphing Inequalities on a Number Line
Quiz
•
6th - 9th Grade
15 questions
Combine Like Terms and Distributive Property
Quiz
•
8th - 9th Grade
10 questions
Plotting Points on a Coordinate Plane: Quadrant 1 Essentials
Interactive video
•
6th - 10th Grade
20 questions
Perfect Squares and Square Roots
Quiz
•
9th Grade
10 questions
Exploring Abiotic and Biotic Factors in Ecosystems
Interactive video
•
6th - 10th Grade
20 questions
Function or Not a Function
Quiz
•
8th - 9th Grade