Graphing Linear Equations and Functions
Interactive Video
•
Mathematics
•
9th - 10th Grade
•
Practice Problem
•
Hard

Jackson Turner
FREE Resource
Read more
10 questions
Show all answers
1.
MULTIPLE CHOICE QUESTION
30 sec • 1 pt
What is the first step in graphing the equation y = 3/2x - 3?
Drawing a straight line
Creating a table of values
Calculating the slope
Plotting random points on the graph
2.
MULTIPLE CHOICE QUESTION
30 sec • 1 pt
Which x-values were chosen to calculate the corresponding y-values?
0, 1, 2, 3, 4
-3, -2, -1, 0, 1
-2, -1, 0, 1, 2
-1, 0, 1, 2, 3
3.
MULTIPLE CHOICE QUESTION
30 sec • 1 pt
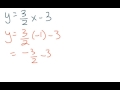
What is the y-value when x = -2 for the equation y = 3/2x - 3?
-3
-6
0
3
4.
MULTIPLE CHOICE QUESTION
30 sec • 1 pt
How is the expression 3/2 * -1 - 3 simplified?
-3/2
-6
-1/2
-9/2
5.
MULTIPLE CHOICE QUESTION
30 sec • 1 pt
What is the y-value when x = 0 for the equation y = 3/2x - 3?
-3
-3/2
0
3/2
6.
MULTIPLE CHOICE QUESTION
30 sec • 1 pt
What is the y-value when x = 1 for the equation y = 3/2x - 3?
0
-3/2
3/2
1
7.
MULTIPLE CHOICE QUESTION
30 sec • 1 pt
What is the y-value when x = 2 for the equation y = 3/2x - 3?
-3
1
0
3
Access all questions and much more by creating a free account
Create resources
Host any resource
Get auto-graded reports
Continue with Google

Continue with Email
Continue with Classlink
Continue with Clever
or continue with
Microsoft
%20(1).png)
Apple
Others
Already have an account?
Popular Resources on Wayground

15 questions
Fractions on a Number Line
Quiz
•
3rd Grade
20 questions
Equivalent Fractions
Quiz
•
3rd Grade
25 questions
Multiplication Facts
Quiz
•
5th Grade
22 questions
fractions
Quiz
•
3rd Grade
20 questions
Main Idea and Details
Quiz
•
5th Grade
20 questions
Context Clues
Quiz
•
6th Grade
15 questions
Equivalent Fractions
Quiz
•
4th Grade
20 questions
Figurative Language Review
Quiz
•
6th Grade
Discover more resources for Mathematics
20 questions
Graphing Inequalities on a Number Line
Quiz
•
6th - 9th Grade
12 questions
Exponential Growth and Decay
Quiz
•
9th Grade
20 questions
Exponent Rules Review
Quiz
•
8th - 9th Grade
25 questions
Complementary and Supplementary Angles
Quiz
•
7th - 10th Grade
12 questions
Add and Subtract Polynomials
Quiz
•
9th - 12th Grade
13 questions
Model Exponential Growth and Decay Scenarios
Quiz
•
9th - 12th Grade
15 questions
Combine Like Terms and Distributive Property
Quiz
•
8th - 9th Grade
27 questions
7.2.3 Quadrilateral Properties
Quiz
•
9th - 12th Grade