Lurking Variables and Correlation Analysis
Interactive Video
•
Other
•
9th - 10th Grade
•
Practice Problem
•
Hard

Amelia Wright
FREE Resource
Read more
10 questions
Show all answers
1.
MULTIPLE CHOICE QUESTION
30 sec • 1 pt
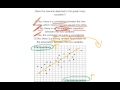
What does the graph indicate about the relationship between doctors per person and life expectancy?
There is a negative correlation.
There is no relationship.
There is a positive correlation.
There is a causation.
2.
MULTIPLE CHOICE QUESTION
30 sec • 1 pt
Why does correlation not imply causation?
Because correlation is a stronger concept than causation.
Because causation is always present in correlated data.
Because correlation can exist without a direct cause-and-effect relationship.
Because correlation always implies causation.
3.
MULTIPLE CHOICE QUESTION
30 sec • 1 pt
Why is option A incorrect regarding the graph's implication?
Because it denies any correlation.
Because it ignores the data.
Because it assumes correlation implies causation.
Because it suggests a negative correlation.
4.
MULTIPLE CHOICE QUESTION
30 sec • 1 pt
What is the flaw in option B's statement about the graph?
It incorrectly states there is no correlation.
It suggests a causation that is not present.
It provides an accurate analysis.
It correctly identifies the correlation.
5.
MULTIPLE CHOICE QUESTION
30 sec • 1 pt
Why is the correlation between doctors per person and life expectancy not a coincidence?
Because they are completely independent variables.
Because both are related to the quality of healthcare.
Because more doctors always lead to lower life expectancy.
Because they are unrelated to healthcare.
6.
MULTIPLE CHOICE QUESTION
30 sec • 1 pt
What does option C suggest about the correlation?
It is purely coincidental.
It is unrelated to any external factors.
It is due to a direct cause-and-effect relationship.
It is related to healthcare quality.
7.
MULTIPLE CHOICE QUESTION
30 sec • 1 pt
What is a lurking variable in the context of this graph?
A hidden variable that affects the observed variables.
A variable that is unrelated to the study.
A variable that has no impact on the study.
A variable that is directly measured.
Access all questions and much more by creating a free account
Create resources
Host any resource
Get auto-graded reports
Continue with Google

Continue with Email
Continue with Classlink
Continue with Clever
or continue with
Microsoft
%20(1).png)
Apple
Others
Already have an account?
Popular Resources on Wayground

15 questions
Fractions on a Number Line
Quiz
•
3rd Grade
20 questions
Equivalent Fractions
Quiz
•
3rd Grade
25 questions
Multiplication Facts
Quiz
•
5th Grade
29 questions
Alg. 1 Section 5.1 Coordinate Plane
Quiz
•
9th Grade
22 questions
fractions
Quiz
•
3rd Grade
11 questions
FOREST Effective communication
Lesson
•
KG
20 questions
Main Idea and Details
Quiz
•
5th Grade
20 questions
Context Clues
Quiz
•
6th Grade
Discover more resources for Other
29 questions
Alg. 1 Section 5.1 Coordinate Plane
Quiz
•
9th Grade
20 questions
El Verbo IR Practice
Quiz
•
9th Grade
20 questions
-AR -ER -IR present tense
Quiz
•
10th - 12th Grade
10 questions
Cell Organelles and Their Functions
Interactive video
•
6th - 10th Grade
20 questions
Graphing Inequalities on a Number Line
Quiz
•
6th - 9th Grade
20 questions
Combining Sentences
Lesson
•
9th Grade
22 questions
El Imperfecto
Quiz
•
9th - 12th Grade
20 questions
Box and Whisker Plots
Quiz
•
9th Grade