Understanding Savings and Visual Representation
Interactive Video
•
Mathematics
•
4th - 5th Grade
•
Practice Problem
•
Hard

Jackson Turner
FREE Resource
Read more
6 questions
Show all answers
1.
MULTIPLE CHOICE QUESTION
30 sec • 1 pt
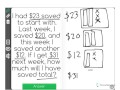
How much money did the person initially have saved?
$23
$20
$31
$12
2.
MULTIPLE CHOICE QUESTION
30 sec • 1 pt
How much money was saved last week?
$31
$20
$23
$12
3.
MULTIPLE CHOICE QUESTION
30 sec • 1 pt
What does each bar represent in the visual representation?
$5
$1
$10
$20
4.
MULTIPLE CHOICE QUESTION
30 sec • 1 pt
How is $12 represented in the visual model?
3 bars
1 bar and 1 X
2 bars
1 bar and 2 X's
5.
MULTIPLE CHOICE QUESTION
30 sec • 1 pt
What is the total amount saved after adding all the amounts together?
$86
$80
$100
$90
6.
MULTIPLE CHOICE QUESTION
30 sec • 1 pt
How many tens are counted in the total savings calculation?
8
9
6
7
Access all questions and much more by creating a free account
Create resources
Host any resource
Get auto-graded reports
Continue with Google

Continue with Email
Continue with Classlink
Continue with Clever
or continue with
Microsoft
%20(1).png)
Apple
Others
Already have an account?
Similar Resources on Wayground

6 questions
Image Interpretation and Description
Interactive video
•
3rd - 6th Grade
6 questions
Tomato farms
Interactive video
•
KG - 3rd Grade
11 questions
Understanding Pie Charts Concepts
Interactive video
•
5th - 6th Grade
8 questions
Median, Mean, Mode, and Range
Interactive video
•
6th - 7th Grade
6 questions
CLEAN: Gabon's footballers facing an uphill task
Interactive video
•
6th - 7th Grade
7 questions
The Little Red Riding Hood
Interactive video
•
4th Grade
8 questions
Identifying Patterns when Skip Counting by Hundreds
Interactive video
•
1st - 6th Grade
6 questions
Calculating Percentages and Discounts
Interactive video
•
5th - 6th Grade
Popular Resources on Wayground
7 questions
History of Valentine's Day
Interactive video
•
4th Grade
15 questions
Fractions on a Number Line
Quiz
•
3rd Grade
20 questions
Equivalent Fractions
Quiz
•
3rd Grade
25 questions
Multiplication Facts
Quiz
•
5th Grade
22 questions
fractions
Quiz
•
3rd Grade
15 questions
Valentine's Day Trivia
Quiz
•
3rd Grade
20 questions
Main Idea and Details
Quiz
•
5th Grade
20 questions
Context Clues
Quiz
•
6th Grade
Discover more resources for Mathematics
25 questions
Multiplication Facts
Quiz
•
5th Grade
15 questions
Equivalent Fractions
Quiz
•
4th Grade
20 questions
Classifying Triangles
Quiz
•
5th Grade
14 questions
Fractions to Decimals & Decimals to Fractions
Quiz
•
4th Grade
10 questions
Multiplying Fractions
Quiz
•
5th Grade
77 questions
Mixed Multiplication and Division Facts
Quiz
•
4th Grade
10 questions
Data Collection
Quiz
•
4th Grade
16 questions
multiplication facts
Quiz
•
4th Grade