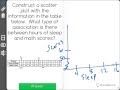
Math Scores and Sleep Patterns
Interactive Video
•
Mathematics
•
9th - 10th Grade
•
Practice Problem
•
Hard

Olivia Brooks
FREE Resource
Read more
9 questions
Show all answers
1.
MULTIPLE CHOICE QUESTION
30 sec • 1 pt
What is the primary purpose of constructing a scatter plot?
To find the average of data points
To calculate the sum of data points
To organize data in a tabular form
To identify patterns or relationships between two variables
2.
MULTIPLE CHOICE QUESTION
30 sec • 1 pt
Which variable is used as the x-axis in the scatter plot discussed?
Math scores
Hours of sleep
Age of students
Number of study hours
3.
MULTIPLE CHOICE QUESTION
30 sec • 1 pt
What is the range of hours of sleep used for the x-axis?
5 to 12 hours
3 to 14 hours
4 to 13 hours
0 to 10 hours
4.
MULTIPLE CHOICE QUESTION
30 sec • 1 pt
What increment is used for the math scores on the y-axis?
5
15
10
20
5.
MULTIPLE CHOICE QUESTION
30 sec • 1 pt
What is the purpose of inserting a squiggle at the bottom of the y-axis?
To highlight important data points
To show the starting point of the data
To make the graph more visually appealing
To indicate a break in the data
6.
MULTIPLE CHOICE QUESTION
30 sec • 1 pt
Which data point is plotted first on the scatter plot?
(4, 55)
(12, 64)
(8, 89)
(10, 81)
7.
MULTIPLE CHOICE QUESTION
30 sec • 1 pt
What type of association is identified between hours of sleep and math scores?
Linear association
No association
Nonlinear association
Inverse association
Access all questions and much more by creating a free account
Create resources
Host any resource
Get auto-graded reports
Continue with Google

Continue with Email
Continue with Classlink
Continue with Clever
or continue with
Microsoft
%20(1).png)
Apple
Others
Already have an account?
Popular Resources on Wayground

15 questions
Fractions on a Number Line
Quiz
•
3rd Grade
20 questions
Equivalent Fractions
Quiz
•
3rd Grade
25 questions
Multiplication Facts
Quiz
•
5th Grade
54 questions
Analyzing Line Graphs & Tables
Quiz
•
4th Grade
22 questions
fractions
Quiz
•
3rd Grade
20 questions
Main Idea and Details
Quiz
•
5th Grade
20 questions
Context Clues
Quiz
•
6th Grade
15 questions
Equivalent Fractions
Quiz
•
4th Grade
Discover more resources for Mathematics
20 questions
Graphing Inequalities on a Number Line
Quiz
•
6th - 9th Grade
18 questions
SAT Prep: Ratios, Proportions, & Percents
Quiz
•
9th - 10th Grade
12 questions
Exponential Growth and Decay
Quiz
•
9th Grade
12 questions
Parallel Lines Cut by a Transversal
Quiz
•
10th Grade
12 questions
Add and Subtract Polynomials
Quiz
•
9th - 12th Grade
15 questions
Combine Like Terms and Distributive Property
Quiz
•
8th - 9th Grade
20 questions
Function or Not a Function
Quiz
•
8th - 9th Grade
10 questions
Elijah McCoy: Innovations and Impact in Black History
Interactive video
•
6th - 10th Grade