Analyzing Graphs of Climbing Patterns
Interactive Video
•
Physics
•
6th - 8th Grade
•
Practice Problem
•
Hard

Aiden Montgomery
FREE Resource
Read more
7 questions
Show all answers
1.
MULTIPLE CHOICE QUESTION
30 sec • 1 pt
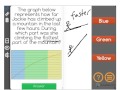
What does the graph represent in the context of Jackie's climb?
The equipment used by Jackie.
The weather conditions during the climb.
The height of the mountain.
The distance Jackie has traveled over time.
2.
MULTIPLE CHOICE QUESTION
30 sec • 1 pt
How does the steepness of a hill affect the speed of climbing?
Steeper hills are climbed faster.
Speed is the same regardless of steepness.
Flatter hills are climbed faster.
Steepness has no effect on speed.
3.
MULTIPLE CHOICE QUESTION
30 sec • 1 pt
In which section of the graph did Jackie climb the fastest?
In the red section.
In the green section.
In the yellow section.
In the blue section.
4.
MULTIPLE CHOICE QUESTION
30 sec • 1 pt
What does the green section of the graph indicate about Jackie's speed?
She was not moving at all.
She was walking at the same speed as in the blue section.
She was walking slower than in the blue section.
She was walking faster than in the blue section.
5.
MULTIPLE CHOICE QUESTION
30 sec • 1 pt
What inference can be made about the blue section of the graph?
It represents the starting point of the climb.
It represents the most dangerous part of the climb.
It represents the flattest part of the mountain.
It represents the steepest part of the mountain.
6.
MULTIPLE CHOICE QUESTION
30 sec • 1 pt
What does the yellow section of the graph suggest about the mountain's steepness?
It was steeper than the blue section but less steep than the green section.
It was the steepest part of the mountain.
It was the same steepness as the green section.
It was flatter than the blue section.
7.
MULTIPLE CHOICE QUESTION
30 sec • 1 pt
What is the overall shape of the mountain as inferred from the graph?
The mountain is consistently steep.
The mountain starts flat and becomes steeper.
The mountain is flat throughout.
The mountain is steep at the bottom and flat at the top.
Access all questions and much more by creating a free account
Create resources
Host any resource
Get auto-graded reports
Continue with Google

Continue with Email
Continue with Classlink
Continue with Clever
or continue with
Microsoft
%20(1).png)
Apple
Others
Already have an account?
Similar Resources on Wayground
Popular Resources on Wayground

7 questions
History of Valentine's Day
Interactive video
•
4th Grade
15 questions
Fractions on a Number Line
Quiz
•
3rd Grade
20 questions
Equivalent Fractions
Quiz
•
3rd Grade
25 questions
Multiplication Facts
Quiz
•
5th Grade
22 questions
fractions
Quiz
•
3rd Grade
15 questions
Valentine's Day Trivia
Quiz
•
3rd Grade
20 questions
Main Idea and Details
Quiz
•
5th Grade
20 questions
Context Clues
Quiz
•
6th Grade
Discover more resources for Physics
15 questions
Waves, Parts of Waves and Wave Properties
Quiz
•
5th - 7th Grade
16 questions
Unit 8 - Mechanical Waves
Quiz
•
8th Grade
19 questions
Generators, Motors, and Transformers
Quiz
•
8th Grade - University
10 questions
Conductors and Insulators Quiz
Quiz
•
6th Grade
31 questions
Unit 5 Force and Motion
Quiz
•
6th Grade
15 questions
KINETIC AND POTENTIAL ENERGY INTRO
Quiz
•
6th Grade