Analyzing Temperature Distributions
Interactive Video
•
Mathematics
•
9th - 10th Grade
•
Practice Problem
•
Hard

Thomas White
FREE Resource
Read more
21 questions
Show all answers
1.
MULTIPLE CHOICE QUESTION
30 sec • 1 pt
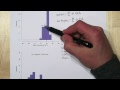
What is the first step in analyzing the histogram for Kahalui?
Finding the median temperature
Locating 80° on the histogram
Calculating the range of temperatures
Identifying the frequency axis
2.
MULTIPLE CHOICE QUESTION
30 sec • 1 pt
How many days in Kahalui had mean temperatures less than 80°?
50 days
11 days
44 days
22 days
3.
MULTIPLE CHOICE QUESTION
30 sec • 1 pt
What is the complementary approach used for Los Angeles?
Calculating the average temperature
Using the median temperature
Counting days above 80° and subtracting from total
Counting days below 80° directly
4.
MULTIPLE CHOICE QUESTION
30 sec • 1 pt
What percentage of days in Los Angeles had temperatures below 80°?
92%
44%
50%
80%
5.
MULTIPLE CHOICE QUESTION
30 sec • 1 pt
What is the common trick in statistics mentioned in the video?
Ignore outliers in data
Count the complement and subtract from the total
Use the median for all calculations
Always calculate the mean first
6.
MULTIPLE CHOICE QUESTION
30 sec • 1 pt
What does the acronym 'SOCKS' help with?
Calculating temperature ranges
Describing distributions
Remembering statistical formulas
Finding median values
7.
MULTIPLE CHOICE QUESTION
30 sec • 1 pt
How is the shape of Kahalui's temperature distribution described?
Bimodal and skewed right
Bimodal and skewed left
Unimodal and skewed left
Uniform and symmetrical
Access all questions and much more by creating a free account
Create resources
Host any resource
Get auto-graded reports
Continue with Google

Continue with Email
Continue with Classlink
Continue with Clever
or continue with
Microsoft
%20(1).png)
Apple
Others
Already have an account?
Popular Resources on Wayground

15 questions
Fractions on a Number Line
Quiz
•
3rd Grade
20 questions
Equivalent Fractions
Quiz
•
3rd Grade
25 questions
Multiplication Facts
Quiz
•
5th Grade
54 questions
Analyzing Line Graphs & Tables
Quiz
•
4th Grade
22 questions
fractions
Quiz
•
3rd Grade
20 questions
Main Idea and Details
Quiz
•
5th Grade
20 questions
Context Clues
Quiz
•
6th Grade
15 questions
Equivalent Fractions
Quiz
•
4th Grade
Discover more resources for Mathematics
20 questions
Graphing Inequalities on a Number Line
Quiz
•
6th - 9th Grade
18 questions
SAT Prep: Ratios, Proportions, & Percents
Quiz
•
9th - 10th Grade
12 questions
Exponential Growth and Decay
Quiz
•
9th Grade
12 questions
Parallel Lines Cut by a Transversal
Quiz
•
10th Grade
12 questions
Add and Subtract Polynomials
Quiz
•
9th - 12th Grade
15 questions
Combine Like Terms and Distributive Property
Quiz
•
8th - 9th Grade
20 questions
Function or Not a Function
Quiz
•
8th - 9th Grade
10 questions
Elijah McCoy: Innovations and Impact in Black History
Interactive video
•
6th - 10th Grade