Understanding Deviations in Height
Interactive Video
•
Mathematics
•
9th - 10th Grade
•
Practice Problem
•
Hard

Thomas White
FREE Resource
Read more
17 questions
Show all answers
1.
MULTIPLE CHOICE QUESTION
30 sec • 1 pt
What is the primary focus when comparing the two groups in the video?
Age differences
Height differences
Weight differences
Gender differences
2.
MULTIPLE CHOICE QUESTION
30 sec • 1 pt
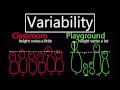
Which two groups are being compared in terms of height?
A group of teachers and a group of students
A group of scientists and a group of artists
A group of athletes and a group of musicians
A classroom of 13-year-olds and a playground group
3.
MULTIPLE CHOICE QUESTION
30 sec • 1 pt
What is the average height of the people in the classroom compared to the playground?
Higher in the classroom
Lower in the classroom
The same in both groups
Higher in the playground
4.
MULTIPLE CHOICE QUESTION
30 sec • 1 pt
Why is the average height not a distinguishing factor between the two groups?
Because the average height is irrelevant
Because the average height is the same in both groups
Because the average height is not measurable
Because the average height is too variable
5.
MULTIPLE CHOICE QUESTION
30 sec • 1 pt
What is the significance of the average height line in the video?
It represents the mean height
It measures the variability
It shows the tallest person
It indicates the shortest person
6.
MULTIPLE CHOICE QUESTION
30 sec • 1 pt
What is the term used to describe the differences in height within a group?
Average
Deviation
Variability
Standard deviation
7.
MULTIPLE CHOICE QUESTION
30 sec • 1 pt
How does height variability differ between the classroom and the playground?
It is negligible in both
It is the same in both
It is greater in the playground
It is greater in the classroom
Access all questions and much more by creating a free account
Create resources
Host any resource
Get auto-graded reports
Continue with Google

Continue with Email
Continue with Classlink
Continue with Clever
or continue with
Microsoft
%20(1).png)
Apple
Others
Already have an account?
