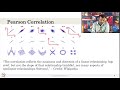
Understanding Pearson Correlation Coefficient
Interactive Video
•
Mathematics
•
9th - 10th Grade
•
Practice Problem
•
Hard

Thomas White
FREE Resource
Read more
9 questions
Show all answers
1.
MULTIPLE CHOICE QUESTION
30 sec • 1 pt
What does correlation indicate in statistics?
The non-linear relationship between two variables
The linear relationship between two variables
The relationship between three variables
The non-linear relationship between three variables
2.
MULTIPLE CHOICE QUESTION
30 sec • 1 pt
What does a correlation coefficient value of 0.5 signify?
A weak negative relationship
No relationship between variables
A strong positive relationship
A moderate positive relationship
3.
MULTIPLE CHOICE QUESTION
30 sec • 1 pt
Which correlation coefficient is most commonly used in Excel?
None of the above
Pearson correlation
Kendall's correlation
Spearman's rank correlation
4.
MULTIPLE CHOICE QUESTION
30 sec • 1 pt
What is the range of values for the Pearson correlation coefficient?
-2 to 2
-1 to 1
0 to 1
-0.5 to 0.5
5.
MULTIPLE CHOICE QUESTION
30 sec • 1 pt
In the example of student attendance and marks, what type of correlation was observed?
Negative correlation
Perfect correlation
No correlation
Positive correlation
6.
MULTIPLE CHOICE QUESTION
30 sec • 1 pt
What does a correlation coefficient of 0.8 indicate?
A strong positive correlation
A weak positive correlation
No correlation
A strong negative correlation
7.
MULTIPLE CHOICE QUESTION
30 sec • 1 pt
Which of the following is a limitation of the Pearson correlation coefficient?
It is only used for non-linear data
It does not capture non-linear relationships
It indicates the slope of the relationship
It captures non-linear relationships
Access all questions and much more by creating a free account
Create resources
Host any resource
Get auto-graded reports
Continue with Google

Continue with Email
Continue with Classlink
Continue with Clever
or continue with
Microsoft
%20(1).png)
Apple
Others
Already have an account?
