Understanding Picture Graphs and Data
Interactive Video
•
Mathematics
•
2nd - 3rd Grade
•
Practice Problem
•
Hard

Thomas White
FREE Resource
Read more
18 questions
Show all answers
1.
MULTIPLE CHOICE QUESTION
30 sec • 1 pt
What is the main purpose of a picture graph?
To show numerical data using numbers
To represent data using pictures
To display data in a table format
To compare data using bar charts
2.
MULTIPLE CHOICE QUESTION
30 sec • 1 pt
What does each picture in a picture graph represent?
A shape
A number
A color
A child
3.
MULTIPLE CHOICE QUESTION
30 sec • 1 pt
In the cube graph, how many green cubes are there?
Four
Five
Three
Two
4.
MULTIPLE CHOICE QUESTION
30 sec • 1 pt
How many more blue cubes are there than green cubes in the graph?
Two
Four
One
Three
5.
MULTIPLE CHOICE QUESTION
30 sec • 1 pt
In the cube graph, what do the extra blue cubes indicate?
More blue cubes
More green cubes
Fewer blue cubes
Equal cubes
6.
MULTIPLE CHOICE QUESTION
30 sec • 1 pt
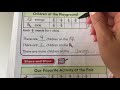
In the playground example, how many children are on the swings?
Two
Three
Four
Five
7.
MULTIPLE CHOICE QUESTION
30 sec • 1 pt
How many children are represented by each picture in the playground example?
Four
Three
Two
One
Access all questions and much more by creating a free account
Create resources
Host any resource
Get auto-graded reports
Continue with Google

Continue with Email
Continue with Classlink
Continue with Clever
or continue with
Microsoft
%20(1).png)
Apple
Others
Already have an account?
Similar Resources on Wayground
Popular Resources on Wayground

15 questions
Fractions on a Number Line
Quiz
•
3rd Grade
20 questions
Equivalent Fractions
Quiz
•
3rd Grade
25 questions
Multiplication Facts
Quiz
•
5th Grade
54 questions
Analyzing Line Graphs & Tables
Quiz
•
4th Grade
22 questions
fractions
Quiz
•
3rd Grade
20 questions
Main Idea and Details
Quiz
•
5th Grade
20 questions
Context Clues
Quiz
•
6th Grade
15 questions
Equivalent Fractions
Quiz
•
4th Grade
Discover more resources for Mathematics
15 questions
Fractions on a Number Line
Quiz
•
3rd Grade
20 questions
Equivalent Fractions
Quiz
•
3rd Grade
22 questions
fractions
Quiz
•
3rd Grade
18 questions
Comparing Fractions with same numerator or denominator
Quiz
•
3rd Grade
12 questions
Fractions on a numberline review
Quiz
•
3rd Grade
10 questions
Area
Quiz
•
3rd Grade
20 questions
Fractions
Quiz
•
3rd Grade
100 questions
100 multiplication facts
Quiz
•
3rd Grade