Exploring Distance-Time Graphs and Speed Concepts
Interactive Video
•
Science
•
6th - 10th Grade
•
Practice Problem
•
Medium
Standards-aligned

Amelia Wright
Used 1+ times
FREE Resource
Standards-aligned
10 questions
Show all answers
1.
MULTIPLE CHOICE QUESTION
30 sec • 1 pt
Why is it important not to confuse distance-time graphs with speed-time graphs?
They have the same calculations.
They look exactly the same.
Confusing them can lead to losing easy marks in exams.
They are used for different subjects.
2.
MULTIPLE CHOICE QUESTION
30 sec • 1 pt
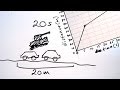
What is the first step in plotting Bob's journey on a distance-time graph?
Start at 0 meters and 0 seconds.
Start at 50 meters and 10 seconds.
Start at 70 meters and 30 seconds.
Start at 100 meters and 35 seconds.
3.
MULTIPLE CHOICE QUESTION
30 sec • 1 pt
How long did it take Bob to cover the first 50 meters?
10 seconds
5 seconds
30 seconds
20 seconds
4.
MULTIPLE CHOICE QUESTION
30 sec • 1 pt
What is the formula to calculate speed?
Speed = Distance + Time
Speed = Distance / Time
Speed = Distance x Time
Speed = Time / Distance
Tags
NGSS.MS-PS3-1
5.
MULTIPLE CHOICE QUESTION
30 sec • 1 pt
What was Bob's speed during the first part of his journey?
10 m/s
6 m/s
5 m/s
1 m/s
Tags
NGSS.MS-PS3-1
6.
MULTIPLE CHOICE QUESTION
30 sec • 1 pt
What does the gradient of a distance-time graph represent?
The speed or average speed
The total time taken
The total distance traveled
The acceleration
7.
MULTIPLE CHOICE QUESTION
30 sec • 1 pt
What was Bob's speed during the second part of his journey?
1 m/s
5 m/s
6 m/s
10 m/s
Tags
NGSS.MS-PS3-1
Access all questions and much more by creating a free account
Create resources
Host any resource
Get auto-graded reports
Continue with Google

Continue with Email
Continue with Classlink
Continue with Clever
or continue with
Microsoft
%20(1).png)
Apple
Others
Already have an account?
