- Resource Library
- Science
- Physical Science
- Calculating Density
- Calculating Density From Mass And Volume Data
Calculating Density from Mass and Volume Data
Interactive Video
•
Science
•
6th - 10th Grade
•
Practice Problem
•
Hard
Standards-aligned

Ethan Morris
FREE Resource
Standards-aligned
10 questions
Show all answers
1.
MULTIPLE CHOICE QUESTION
30 sec • 1 pt
What are the two main topics covered in the video?
Kinetics and Equilibrium
Atomic Structure and Bonding
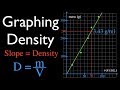
Density and Graphing
Mass and Volume
Tags
NGSS.MS-PS2-1
NGSS.MS-PS3-1
NGSS.MS-PS3-5
2.
MULTIPLE CHOICE QUESTION
30 sec • 1 pt
What should be labeled on the y-axis when plotting the data?
Volume
Density
Time
Mass
3.
MULTIPLE CHOICE QUESTION
30 sec • 1 pt
How many different masses and volumes were collected for the graph?
Six
Five
Four
Three
4.
MULTIPLE CHOICE QUESTION
30 sec • 1 pt
What does the slope of the best-fit line represent in the context of the graph?
Mass
Volume
Time
Density
5.
MULTIPLE CHOICE QUESTION
30 sec • 1 pt
What is the formula for calculating the slope of the line?
Change in X / Change in Y
Volume / Mass
Mass / Volume
Change in Y / Change in X
6.
MULTIPLE CHOICE QUESTION
30 sec • 1 pt
What is the density if the mass is 240 grams and the volume is 70 milliliters?
3.43 grams per milliliter
2.40 grams per milliliter
4.29 grams per milliliter
3.00 grams per milliliter
7.
MULTIPLE CHOICE QUESTION
30 sec • 1 pt
Why might the calculated density slightly differ when using different points on the graph?
Measurement errors
Different materials
Calculation mistakes
Graph scaling issues
Access all questions and much more by creating a free account
Create resources
Host any resource
Get auto-graded reports
Continue with Google

Continue with Email
Continue with Microsoft
or continue with

%20(1).png)
Apple
Others
Already have an account?
