Exploring Measures of Variability in Statistics
Interactive Video
•
Mathematics
•
6th - 10th Grade
•
Practice Problem
•
Easy
+4
Standards-aligned

Olivia Brooks
Used 1+ times
FREE Resource
Standards-aligned
Read more
10 questions
Show all answers
1.
MULTIPLE CHOICE QUESTION
30 sec • 1 pt
Why is it important to consider measures of variability in addition to measures of central tendency?
To understand the average value of the data
To know the total number of data points
To determine the mode of the data
To capture how spread out or clustered the data points are
Tags
CCSS.6.SP.A.3
2.
MULTIPLE CHOICE QUESTION
30 sec • 1 pt
In the example of the pharmaceutical company, why might one choose medication B over medication A?
Medication B has fewer side effects
Medication B is cheaper
Medication B has a higher mean improvement
Medication B shows more consistent improvement
Tags
CCSS.7.SP.B.4
3.
MULTIPLE CHOICE QUESTION
30 sec • 1 pt
What is the formula for calculating the range?
R = H * L
R = H - L
R = H + L
R = L - H
Tags
CCSS.6.SP.B.4
CCSS.HSS.ID.A.1
4.
MULTIPLE CHOICE QUESTION
30 sec • 1 pt
What is a major limitation of using the range as a measure of variability?
It requires a large dataset
It cannot be used with categorical data
It only considers the highest and lowest values
It is too complex to calculate
Tags
CCSS.6.SP.B.5D
CCSS.HSS.ID.A.2
5.
MULTIPLE CHOICE QUESTION
30 sec • 1 pt
What does standard deviation measure?
The difference between the highest and lowest scores
The average value of the data
The typical amount that scores deviate from the mean
The total number of data points
6.
MULTIPLE CHOICE QUESTION
30 sec • 1 pt
Which symbol represents the population standard deviation?
Σ
s
μ
σ
7.
MULTIPLE CHOICE QUESTION
30 sec • 1 pt
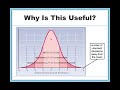
What percentage of data falls within one standard deviation of the mean in a normal distribution?
99.7%
50%
68%
95%
Tags
CCSS.HSS.ID.A.4
Access all questions and much more by creating a free account
Create resources
Host any resource
Get auto-graded reports
Continue with Google

Continue with Email
Continue with Classlink
Continue with Clever
or continue with
Microsoft
%20(1).png)
Apple
Others
Already have an account?
