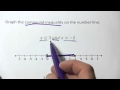
Graphing Compound Inequalities on the Number Line
Interactive Video
•
Mathematics
•
6th - 10th Grade
•
Practice Problem
•
Hard
Standards-aligned

Amelia Wright
FREE Resource
Standards-aligned
Read more
10 questions
Show all answers
1.
MULTIPLE CHOICE QUESTION
30 sec • 1 pt
What does a compound inequality mean?
An inequality with more than one part
An inequality with a single variable
An inequality with no solution
An inequality with only one part
2.
MULTIPLE CHOICE QUESTION
30 sec • 1 pt
In a compound inequality with 'and', what part of the graph do you shade?
Where both inequalities are true
The entire graph
Where neither inequality is true
Where either inequality is true
3.
MULTIPLE CHOICE QUESTION
30 sec • 1 pt
How do you represent 'X is less than or equal to 3' on a graph?
A solid dot at 3
An open circle at -3
An open circle at 3
A solid dot at -3
Tags
CCSS.6.EE.B.8
4.
MULTIPLE CHOICE QUESTION
30 sec • 1 pt
What type of dot is used to represent 'X is greater than negative 2'?
A solid dot
An open circle
A filled-in dot
A shaded dot
Tags
CCSS.6.EE.B.8
5.
MULTIPLE CHOICE QUESTION
30 sec • 1 pt
When graphing 'and' compound inequalities, where do you shade?
Where either inequality is true
Where both inequalities overlap
The entire graph
Where neither inequality is true
6.
MULTIPLE CHOICE QUESTION
30 sec • 1 pt
How do you graph 'X is less than or equal to 3 and X is greater than -2'?
Shade the entire graph
Shade where both conditions overlap
Shade where either condition is true
Do not shade any part of the graph
7.
MULTIPLE CHOICE QUESTION
30 sec • 1 pt
In a compound inequality with 'or', what part of the graph do you shade?
Where neither inequality is true
Where both inequalities are true
Where either inequality is true
The entire graph
Access all questions and much more by creating a free account
Create resources
Host any resource
Get auto-graded reports
Continue with Google

Continue with Email
Continue with Classlink
Continue with Clever
or continue with
Microsoft
%20(1).png)
Apple
Others
Already have an account?
