Graphing Absolute Value Functions Explained
Interactive Video
•
Mathematics
•
8th - 12th Grade
•
Practice Problem
•
Hard
Standards-aligned

Liam Anderson
FREE Resource
Standards-aligned
Read more
10 questions
Show all answers
1.
MULTIPLE CHOICE QUESTION
30 sec • 1 pt
What is the parent function of an absolute value function?
y = 1/x
y = x
y = |x|
y = x^2
2.
MULTIPLE CHOICE QUESTION
30 sec • 1 pt
What shape does the graph of an absolute value function form?
A parabola
A straight line
A circle
A V shape
Tags
CCSS.HSF-IF.C.7D
3.
MULTIPLE CHOICE QUESTION
30 sec • 1 pt
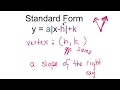
In the standard form of an absolute value function, what does the 'H' represent?
The slope of the right ray
The x-coordinate of the vertex
The y-coordinate of the vertex
The y-intercept
Tags
CCSS.HSF-IF.C.7D
4.
MULTIPLE CHOICE QUESTION
30 sec • 1 pt
How do you determine the slope of the right ray in an absolute value function?
By finding the y-intercept
By using the quadratic formula
By looking at the coefficient in front of the absolute value
By calculating the distance between two points
Tags
CCSS.HSF-IF.C.7D
5.
MULTIPLE CHOICE QUESTION
30 sec • 1 pt
If the slope of the right ray is negative, how does the V shape of the graph change?
It remains the same
It opens upside down
It opens to the right
It opens to the left
6.
MULTIPLE CHOICE QUESTION
30 sec • 1 pt
What happens to the width of the V shape when the slope is a fraction less than 1?
It becomes wider
It becomes narrower
It becomes a straight line
It remains the same
7.
MULTIPLE CHOICE QUESTION
30 sec • 1 pt
How do you reflect the parent function across the x-axis?
By adding a positive constant to the function
By subtracting a constant from the function
By making the coefficient of the absolute value negative
By shifting the graph to the right
Access all questions and much more by creating a free account
Create resources
Host any resource
Get auto-graded reports
Continue with Google

Continue with Email
Continue with Classlink
Continue with Clever
or continue with
Microsoft
%20(1).png)
Apple
Others
Already have an account?
Popular Resources on Wayground

15 questions
Fractions on a Number Line
Quiz
•
3rd Grade
20 questions
Equivalent Fractions
Quiz
•
3rd Grade
25 questions
Multiplication Facts
Quiz
•
5th Grade
22 questions
fractions
Quiz
•
3rd Grade
20 questions
Main Idea and Details
Quiz
•
5th Grade
20 questions
Context Clues
Quiz
•
6th Grade
15 questions
Equivalent Fractions
Quiz
•
4th Grade
20 questions
Figurative Language Review
Quiz
•
6th Grade
Discover more resources for Mathematics
15 questions
Product of Powers Property A1 U7
Quiz
•
8th Grade
20 questions
Laws of Exponents
Quiz
•
8th Grade
16 questions
8th U5L5 Graphs of Functions
Quiz
•
8th Grade
20 questions
Graphing Inequalities on a Number Line
Quiz
•
6th - 9th Grade
12 questions
Exponential Growth and Decay
Quiz
•
9th Grade
20 questions
Exponent Rules Review
Quiz
•
8th - 9th Grade
20 questions
One Step equations addition and subtraction
Quiz
•
5th - 8th Grade
20 questions
Translations
Quiz
•
8th Grade