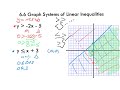
Graphing Systems of Linear Inequalities
Interactive Video
•
Mathematics
•
6th - 10th Grade
•
Practice Problem
•
Hard
+2
Standards-aligned

Liam Anderson
FREE Resource
Standards-aligned
10 questions
Show all answers
1.
MULTIPLE CHOICE QUESTION
30 sec • 1 pt
What is the main focus of this lesson?
Factoring polynomials
Solving quadratic equations
Graphing systems of linear inequalities
Graphing linear equations
Tags
CCSS.HSA.REI.C.7
2.
MULTIPLE CHOICE QUESTION
30 sec • 1 pt
When graphing the inequality y > -2x - 5, where is the starting point on the y-axis?
At 2
At -5
At -2
At 5
Tags
CCSS.HSA.REI.D.12
3.
MULTIPLE CHOICE QUESTION
30 sec • 1 pt
What type of line is used for the inequality y > -2x - 5?
Dotted line
Dashed line
Solid line
Bold line
Tags
CCSS.HSA.REI.D.12
4.
MULTIPLE CHOICE QUESTION
30 sec • 1 pt
Which test point is commonly used to determine the shading region?
(1,1)
(0,0)
(2,2)
(-1,-1)
Tags
CCSS.HSA.REI.D.12
5.
MULTIPLE CHOICE QUESTION
30 sec • 1 pt
For the inequality y ≤ x + 3, what is the slope of the line?
1
-1
3
-3
6.
MULTIPLE CHOICE QUESTION
30 sec • 1 pt
What does the overlapping shaded region represent in a system of linear inequalities?
The solution to one of the inequalities
The solution to both inequalities
The area where only one inequality is satisfied
The area where no solutions exist
Tags
CCSS.HSA.REI.D.12
7.
MULTIPLE CHOICE QUESTION
30 sec • 1 pt
What is the first step in converting an inequality to slope-intercept form?
Subtract the x-term from both sides
Multiply both sides by the slope
Add the x-term to both sides
Divide both sides by the y-intercept
Tags
CCSS.8.EE.B.6
CCSS.8.F.A.3
Access all questions and much more by creating a free account
Create resources
Host any resource
Get auto-graded reports
Continue with Google

Continue with Email
Continue with Classlink
Continue with Clever
or continue with
Microsoft
%20(1).png)
Apple
Others
Already have an account?
