Exploring Proportional Relationships through Graphing
Interactive Video
•
Mathematics
•
6th - 10th Grade
•
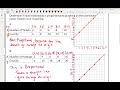
Practice Problem
•
Hard
Standards-aligned

Sophia Harris
FREE Resource
Standards-aligned
Read more
10 questions
Show all answers
1.
MULTIPLE CHOICE QUESTION
30 sec • 1 pt
What is a key characteristic of a proportional relationship on a graph?
It forms a curved line.
It forms a zigzag pattern.
It forms a straight line through the origin.
It forms a straight line that does not pass through the origin.
Tags
CCSS.7.RP.A.2D
2.
MULTIPLE CHOICE QUESTION
30 sec • 1 pt
How can you use a graph to find the constant of proportionality?
By subtracting the x-value from the y-value.
By finding the slope of the line.
By adding the x and y values of an ordered pair.
By dividing the y-value by the x-value of an ordered pair.
Tags
CCSS.7.RP.A.2D
3.
MULTIPLE CHOICE QUESTION
30 sec • 1 pt
How do you calculate the constant of proportionality from an ordered pair?
Add the x-value to the y-value.
Subtract the x-value from the y-value.
Divide the y-value by the x-value.
Multiply the x-value by the y-value.
Tags
CCSS.7.RP.A.2B
4.
MULTIPLE CHOICE QUESTION
30 sec • 1 pt
What is the formula for finding the constant of proportionality?
x / y
y / x
x + y
x - y
Tags
CCSS.7.RP.A.2B
5.
MULTIPLE CHOICE QUESTION
30 sec • 1 pt
In the first example, why is the relationship not proportional?
The points do not form a straight line.
The points form a zigzag pattern.
The points form a straight line but do not pass through the origin.
The points form a curved line.
Tags
CCSS.7.RP.A.2D
6.
MULTIPLE CHOICE QUESTION
30 sec • 1 pt
In the first example, what were the ordered pairs used to plot the points?
(1, 3), (2, 6), (3, 9), (4, 12), (5, 15)
(2, 6), (4, 8), (6, 10), (8, 12), (10, 14)
(2, 6), (4, 12), (6, 18), (8, 24), (10, 30)
(1, 2), (2, 4), (3, 6), (4, 8), (5, 10)
Tags
CCSS.5.OA.B.3
7.
MULTIPLE CHOICE QUESTION
30 sec • 1 pt
In the second example, what adjustment was made to the y-axis?
The y-axis was labeled by fives.
The y-axis was labeled by threes.
The y-axis was labeled with odd numbers.
The y-axis was labeled with even numbers.
Tags
CCSS.5.OA.B.3
Access all questions and much more by creating a free account
Create resources
Host any resource
Get auto-graded reports
Continue with Google

Continue with Email
Continue with Classlink
Continue with Clever
or continue with
Microsoft
%20(1).png)
Apple
Others
Already have an account?
