Isobars and Air Pressure in Weather Maps
Interactive Video
•
Science
•
6th - 10th Grade
•
Practice Problem
•
Hard

Amelia Wright
FREE Resource
Read more
10 questions
Show all answers
1.
MULTIPLE CHOICE QUESTION
30 sec • 1 pt
What type of weather is typically associated with a surface low pressure area?
Clear and fair weather
Cloudy with precipitation
Cold and windy weather
Hot and dry weather
2.
MULTIPLE CHOICE QUESTION
30 sec • 1 pt
In the northern hemisphere, which direction does cyclonic flow move?
East to West
Counterclockwise
Clockwise
North to South
3.
MULTIPLE CHOICE QUESTION
30 sec • 1 pt
What happens to wind speed when isobars are close together?
Wind speed becomes unpredictable
Wind speed decreases
Wind speed remains the same
Wind speed increases
4.
MULTIPLE CHOICE QUESTION
30 sec • 1 pt
How does the Coriolis effect influence wind direction in the southern hemisphere?
Deflects wind to the right
Reverses wind direction
Deflects wind to the left
Has no effect on wind direction
5.
MULTIPLE CHOICE QUESTION
30 sec • 1 pt
What do isobars represent on a weather map?
Lines of equal temperature
Lines of equal air pressure
Lines of equal humidity
Lines of equal wind speed
6.
MULTIPLE CHOICE QUESTION
30 sec • 1 pt
What is a ridge in terms of air pressure?
A linear low pressure area
A linear high pressure area
A low pressure area
A high pressure area
7.
MULTIPLE CHOICE QUESTION
30 sec • 1 pt
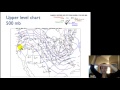
What is the significance of the 500 millibar level in upper-level wind charts?
It represents the surface pressure
It is halfway up in the atmosphere
It shows the lowest pressure point
It indicates the highest pressure point
Access all questions and much more by creating a free account
Create resources
Host any resource
Get auto-graded reports
Continue with Google

Continue with Email
Continue with Classlink
Continue with Clever
or continue with
Microsoft
%20(1).png)
Apple
Others
Already have an account?
