Exploring Linear Functions through Graphing
Interactive Video
•
Mathematics
•
6th - 10th Grade
•
Practice Problem
•
Hard
+4
Standards-aligned

Ethan Morris
FREE Resource
Standards-aligned
Read more
10 questions
Show all answers
1.
MULTIPLE CHOICE QUESTION
30 sec • 1 pt
What is the main goal of the lesson on graphing linear functions?
To understand quadratic functions
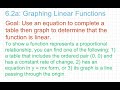
To use an equation to complete a table and graph to determine if the function is linear
To learn about exponential functions
To study the properties of circles
Tags
CCSS.8.F.B.4
CCSS.HSF.LE.A.2
2.
MULTIPLE CHOICE QUESTION
30 sec • 1 pt
Which of the following is NOT a characteristic of a proportional relationship?
A table that includes the ordered pair (0, 0) and has a constant rate of change
An equation in the form y = mx + b
An equation in the form y = mx
A graph that is a line passing through the origin
Tags
CCSS.8.EE.B.5
3.
MULTIPLE CHOICE QUESTION
30 sec • 1 pt
What is the only type of line that is not a function?
Curved line
Horizontal line
Diagonal line
Vertical line
4.
MULTIPLE CHOICE QUESTION
30 sec • 1 pt
Which term is the most specific when describing relationships?
Linear
Proportional
Function
Relationship
Tags
CCSS.8.F.A.3
5.
MULTIPLE CHOICE QUESTION
30 sec • 1 pt
What is the key difference between a proportional and a non-proportional linear relationship?
The slope of the line
The presence of a y-intercept (b) in the equation
The x-intercept of the line
The color of the graph
Tags
CCSS.8.EE.B.5
6.
MULTIPLE CHOICE QUESTION
30 sec • 1 pt
In a proportional relationship, what is the value of the y-intercept (b)?
It varies
1
0
It is undefined
Tags
CCSS.8.EE.B.5
7.
MULTIPLE CHOICE QUESTION
30 sec • 1 pt
How can you verify that a relationship is proportional using a graph?
The graph is a horizontal line
The graph is a curve
The graph passes through the origin and is a straight line
The graph has multiple lines
Tags
CCSS.7.RP.A.2D
Access all questions and much more by creating a free account
Create resources
Host any resource
Get auto-graded reports
Continue with Google

Continue with Email
Continue with Classlink
Continue with Clever
or continue with
Microsoft
%20(1).png)
Apple
Others
Already have an account?
Popular Resources on Wayground

15 questions
Fractions on a Number Line
Quiz
•
3rd Grade
20 questions
Equivalent Fractions
Quiz
•
3rd Grade
25 questions
Multiplication Facts
Quiz
•
5th Grade
22 questions
fractions
Quiz
•
3rd Grade
20 questions
Main Idea and Details
Quiz
•
5th Grade
20 questions
Context Clues
Quiz
•
6th Grade
15 questions
Equivalent Fractions
Quiz
•
4th Grade
20 questions
Figurative Language Review
Quiz
•
6th Grade
Discover more resources for Mathematics
20 questions
Exponents
Quiz
•
6th Grade
22 questions
distributive property
Quiz
•
7th Grade
15 questions
Distributive Property & Review
Quiz
•
6th Grade
20 questions
Writing Algebraic Expressions
Quiz
•
6th Grade
20 questions
Ratios/Rates and Unit Rates
Quiz
•
6th Grade
20 questions
Writing and Graphing Inequalities
Quiz
•
6th Grade
15 questions
Product of Powers Property A1 U7
Quiz
•
8th Grade
20 questions
Laws of Exponents
Quiz
•
8th Grade