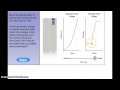
Distance vs. Speed Time Graphs Explained
Interactive Video
•
Science
•
6th - 10th Grade
•
Practice Problem
•
Medium
Standards-aligned

Liam Anderson
Used 2+ times
FREE Resource
Standards-aligned
Read more
10 questions
Show all answers
1.
MULTIPLE CHOICE QUESTION
30 sec • 1 pt
What does a distance-time graph show?
The direction of an object's movement
How far an object has traveled
How fast an object is moving
The acceleration of an object
Tags
NGSS.MS-PS3-1
2.
MULTIPLE CHOICE QUESTION
30 sec • 1 pt
What does a velocity-time graph indicate?
The distance an object has traveled
The direction of an object's movement
The speed of an object
The time taken by an object
Tags
NGSS.MS-PS3-1
3.
MULTIPLE CHOICE QUESTION
30 sec • 1 pt
If a distance-time graph has a steep line, what does it mean?
The object is moving at a constant speed
The object is moving slowly
The object is moving fast
The object has stopped
4.
MULTIPLE CHOICE QUESTION
30 sec • 1 pt
On a velocity-time graph, what does a line going up represent?
The object is speeding up
The object has stopped
The object is slowing down
The object is moving at a constant speed
Tags
NGSS.MS-PS3-1
5.
MULTIPLE CHOICE QUESTION
30 sec • 1 pt
Why does the line on a velocity-time graph not start at zero when a car is already moving?
Because the car is decelerating
Because the car is accelerating
Because the car is already at a certain speed
Because it is showing distance
6.
MULTIPLE CHOICE QUESTION
30 sec • 1 pt
What happens to the velocity-time graph when a car starts fast and then slows down?
The line remains flat
The line goes up
The line goes down
The line curves upwards
7.
MULTIPLE CHOICE QUESTION
30 sec • 1 pt
What does a curved line on a distance-time graph indicate?
The object has stopped
The object is moving at a constant speed
The object is accelerating
The object is decelerating
Access all questions and much more by creating a free account
Create resources
Host any resource
Get auto-graded reports
Continue with Google

Continue with Email
Continue with Classlink
Continue with Clever
or continue with
Microsoft
%20(1).png)
Apple
Others
Already have an account?
Popular Resources on Wayground

15 questions
Fractions on a Number Line
Quiz
•
3rd Grade
10 questions
Probability Practice
Quiz
•
4th Grade
15 questions
Probability on Number LIne
Quiz
•
4th Grade
20 questions
Equivalent Fractions
Quiz
•
3rd Grade
25 questions
Multiplication Facts
Quiz
•
5th Grade
22 questions
fractions
Quiz
•
3rd Grade
6 questions
Appropriate Chromebook Usage
Lesson
•
7th Grade
10 questions
Greek Bases tele and phon
Quiz
•
6th - 8th Grade
Discover more resources for Science
6 questions
Appropriate Chromebook Usage
Lesson
•
7th Grade
20 questions
Rocks and The Rock Cycle
Quiz
•
6th Grade
42 questions
Academic Bowl Questions - Round 2
Quiz
•
7th Grade
10 questions
Exploring the Rock Cycle
Interactive video
•
6th - 8th Grade
12 questions
Ecological Succession
Quiz
•
7th Grade
8 questions
Newton's Second Law
Lesson
•
6th - 8th Grade
8 questions
Amoeba Sister Asexual vs Sexual Reproduction
Interactive video
•
8th Grade
20 questions
Thermal Energy - Heat Transfer
Quiz
•
6th Grade