Reading Dot Plots, Scatter Plots, and Bar Graphs
Interactive Video
•
Mathematics
•
6th - 10th Grade
•
Practice Problem
•
Hard
+3
Standards-aligned

Mia Campbell
FREE Resource
Standards-aligned
10 questions
Show all answers
1.
MULTIPLE CHOICE QUESTION
30 sec • 1 pt
What do scatter plots represent?
One variable represented by numbers
Two variables represented by numbers
Three variables represented by numbers
Four variables represented by numbers
Tags
CCSS.8.SP.A.1
2.
MULTIPLE CHOICE QUESTION
30 sec • 1 pt
What is the purpose of a line of best fit in a scatter plot?
To separate the dots into two groups
To highlight the highest and lowest points
To show the general pattern of the dots
To connect all the dots
Tags
CCSS.8.SP.A.2
3.
MULTIPLE CHOICE QUESTION
30 sec • 1 pt
How do you identify a positive correlation in a scatter plot?
The dots are randomly distributed
The line of best fit goes downwards
The line of best fit is horizontal
The line of best fit goes upwards
Tags
CCSS.HSS.ID.B.5
4.
MULTIPLE CHOICE QUESTION
30 sec • 1 pt
Which of the following is an example of a negative correlation?
Number of books read and intelligence
Days worked and money earned
Miles driven and gas remaining
Hours of TV watched and size of the TV
Tags
CCSS.HSS.ID.B.5
5.
MULTIPLE CHOICE QUESTION
30 sec • 1 pt
What does 'no correlation' mean in a scatter plot?
The dots form a straight line
The dots are randomly distributed
The line of best fit is horizontal
The line of best fit is vertical
Tags
CCSS.HSS.ID.B.5
6.
MULTIPLE CHOICE QUESTION
30 sec • 1 pt
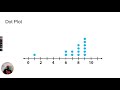
In a dot plot, what does each dot represent?
A group of people
A single person or piece of data
A range of values
A category
Tags
CCSS.6.SP.B.4
CCSS.HSS.ID.A.1
7.
MULTIPLE CHOICE QUESTION
30 sec • 1 pt
How can you find the median using a dot plot?
By counting the total number of dots
By finding the highest stack of dots
By crossing out dots from each side until you reach the middle
By adding all the dots together
Tags
CCSS.6.SP.B.4
CCSS.HSS.ID.A.1
Access all questions and much more by creating a free account
Create resources
Host any resource
Get auto-graded reports
Continue with Google

Continue with Email
Continue with Classlink
Continue with Clever
or continue with
Microsoft
%20(1).png)
Apple
Others
Already have an account?
