Exploring Equivalent Ratios and Graphs
Interactive Video
•
Mathematics
•
6th - 10th Grade
•
Practice Problem
•
Hard
+5
Standards-aligned

Aiden Montgomery
FREE Resource
Standards-aligned
Read more
10 questions
Show all answers
1.
MULTIPLE CHOICE QUESTION
30 sec • 1 pt
What is the essential question of this lesson?
How do we write equivalent ratios?
What is the unit rate of a car traveling at 50 miles per hour?
How can we use a graph to represent ratios?
What is the distance traveled by a car in 2 hours?
Tags
CCSS.7.RP.A.2D
2.
MULTIPLE CHOICE QUESTION
30 sec • 1 pt
If a car travels at 50 miles per hour, how far will it travel in 2 hours?
200 miles
100 miles
50 miles
150 miles
Tags
CCSS.6.RP.A.3B
3.
MULTIPLE CHOICE QUESTION
30 sec • 1 pt
What is the unit rate for a car traveling 50 miles in 1 hour?
100 miles per hour
200 miles per hour
150 miles per hour
50 miles per hour
Tags
CCSS.6.RP.A.1
CCSS.6.RP.A.2
4.
MULTIPLE CHOICE QUESTION
30 sec • 1 pt
How do you represent the ratio of 50 miles per 1 hour as an ordered pair?
(100, 2)
(50, 1)
(1, 50)
(2, 100)
Tags
CCSS.6.RP.A.1
CCSS.6.RP.A.2
5.
MULTIPLE CHOICE QUESTION
30 sec • 1 pt
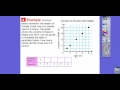
What pattern do the ordered pairs (1, 50), (2, 100), (3, 150) form on the graph?
A dotted line
A zigzag line
A straight line
A curved line
Tags
CCSS.5.OA.B.3
6.
MULTIPLE CHOICE QUESTION
30 sec • 1 pt
During a heavy rainstorm, if the water at Arcade Creek rose steadily for 8 hours, how many inches did it rise in total?
30 inches
36 inches
24 inches
18 inches
Tags
CCSS.3.OA.D.8
7.
MULTIPLE CHOICE QUESTION
30 sec • 1 pt
What does the ordered pair (1, 3) represent in the context of Arcade Creek's water level?
3 hours and 3 inches rise
3 hours and 1 inch rise
1 hour and 3 inches rise
1 hour and 1 inch rise
Tags
CCSS.5.OA.B.3
Access all questions and much more by creating a free account
Create resources
Host any resource
Get auto-graded reports
Continue with Google

Continue with Email
Continue with Classlink
Continue with Clever
or continue with
Microsoft
%20(1).png)
Apple
Others
Already have an account?
