Creating a Table of Values from Graph Points
Interactive Video
•
Mathematics
•
6th - 10th Grade
•
Practice Problem
•
Medium
+3
Standards-aligned

Sophia Harris
Used 2+ times
FREE Resource
Standards-aligned
10 questions
Show all answers
1.
MULTIPLE CHOICE QUESTION
30 sec • 1 pt
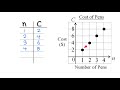
What does the x-axis represent in the graph about the cost of pens?
Number of pens
Distance in kilometers
Cost in dollars
Time in hours
Tags
CCSS.8.EE.B.5
2.
MULTIPLE CHOICE QUESTION
30 sec • 1 pt
If the number of pens (n) is 3, what is the cost (C) according to the graph?
2 dollars
4 dollars
6 dollars
8 dollars
Tags
CCSS.HSF.LE.B.5
3.
MULTIPLE CHOICE QUESTION
30 sec • 1 pt
Why can't we place a dot at 1.5 pens on the cost of pens graph?
Because the graph only allows even numbers
Because it would not form a straight line
Because 1.5 pens is not a whole number and doesn't make sense in real life
Because the cost would be too high
Tags
CCSS.8.EE.B.5
4.
MULTIPLE CHOICE QUESTION
30 sec • 1 pt
What does the y-axis represent in the graph about the position of a car?
Distance in kilometers
Cost in dollars
Number of pens
Time in hours
Tags
CCSS.8.EE.B.5
5.
MULTIPLE CHOICE QUESTION
30 sec • 1 pt
If the time (T) is 3 hours, what is the distance (D) according to the car position graph?
0 kilometers
140 kilometers
210 kilometers
280 kilometers
Tags
CCSS.8.EE.B.5
6.
MULTIPLE CHOICE QUESTION
30 sec • 1 pt
Is it possible to have a value at 2.5 hours on the car position graph?
Yes, because time can be a continuous value
Yes, but only if the distance is also a whole number
No, because 2.5 hours is not a whole number
No, because it would not form a straight line
Tags
CCSS.HSF.IF.B.4
7.
MULTIPLE CHOICE QUESTION
30 sec • 1 pt
What does the linear relation in the car position graph represent?
The time taken
The cost of pens
The speed of the car
The number of pens
Tags
CCSS.8.EE.B.5
Access all questions and much more by creating a free account
Create resources
Host any resource
Get auto-graded reports
Continue with Google

Continue with Email
Continue with Classlink
Continue with Clever
or continue with
Microsoft
%20(1).png)
Apple
Others
Already have an account?
Popular Resources on Wayground

15 questions
Fractions on a Number Line
Quiz
•
3rd Grade
20 questions
Equivalent Fractions
Quiz
•
3rd Grade
25 questions
Multiplication Facts
Quiz
•
5th Grade
29 questions
Alg. 1 Section 5.1 Coordinate Plane
Quiz
•
9th Grade
22 questions
fractions
Quiz
•
3rd Grade
11 questions
FOREST Effective communication
Lesson
•
KG
20 questions
Main Idea and Details
Quiz
•
5th Grade
20 questions
Context Clues
Quiz
•
6th Grade
Discover more resources for Mathematics
29 questions
Alg. 1 Section 5.1 Coordinate Plane
Quiz
•
9th Grade
36 questions
6th Grade Math STAAR Review
Quiz
•
6th Grade
14 questions
Volume of rectangular prisms
Quiz
•
7th Grade
14 questions
finding slope from a graph
Quiz
•
8th Grade
20 questions
Graphing Inequalities on a Number Line
Quiz
•
6th - 9th Grade
23 questions
Solve and Graph Inequalities
Quiz
•
6th Grade
15 questions
Distributive Property & Review
Quiz
•
6th Grade
10 questions
Mean, Median, Mode, and Range
Quiz
•
7th Grade