- Resource Library
- Math
- Probability And Statistics
- Bivariate Data
- Exploring Bivariate Data And Scatter Plot Associations
Exploring Bivariate Data and Scatter Plot Associations
Interactive Video
•
Mathematics
•
6th - 10th Grade
•
Practice Problem
•
Hard
+6
Standards-aligned

Mia Campbell
FREE Resource
Standards-aligned
10 questions
Show all answers
1.
MULTIPLE CHOICE QUESTION
30 sec • 1 pt
What is the primary purpose of a scatter plot?
To measure the central tendency of data
To create a bar chart
To display a single set of data
To show the relationship between two sets of data
Tags
CCSS.8.SP.A.1
2.
MULTIPLE CHOICE QUESTION
30 sec • 1 pt
In the example involving pages in a novel and times checked out, what does an outlier represent?
A data point that fits perfectly with the others
A data point that is very different from the others
A data point that is the average of all others
A data point that is the median of all others
3.
MULTIPLE CHOICE QUESTION
30 sec • 1 pt
What type of correlation is observed when one data set increases while the other decreases?
Negative correlation
No correlation
Positive correlation
Neutral correlation
Tags
CCSS.HSS.ID.B.5
4.
MULTIPLE CHOICE QUESTION
30 sec • 1 pt
When plotting data on a scatter plot, why is it important to be aware of the gauge of measurement?
To accurately represent the relationship between data sets
To make the graph look more colorful
To avoid using too much paper
To ensure the data points are evenly spaced
Tags
CCSS.HSN.Q.A.1
5.
MULTIPLE CHOICE QUESTION
30 sec • 1 pt
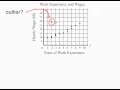
In the work experience and wages example, what does the outlier indicate?
A person with low experience and high wage
A person with no experience and no wage
A person with high experience and low wage
A person with average experience and wage
6.
MULTIPLE CHOICE QUESTION
30 sec • 1 pt
How should the relationship be described when both data sets increase together?
As a neutral relationship
As no relationship
As a positive relationship
As a negative relationship
Tags
CCSS.HSF-LE.A.1B
7.
MULTIPLE CHOICE QUESTION
30 sec • 1 pt
What does a squiggly line on a scatter plot indicate?
A negative correlation
A large number of data points
A section of the graph with no data
A positive correlation
Tags
CCSS.HSS.ID.B.5
Access all questions and much more by creating a free account
Create resources
Host any resource
Get auto-graded reports
Continue with Google

Continue with Email
Continue with Microsoft
or continue with

%20(1).png)
Apple
Others
Already have an account?
