Graphing Piecewise Functions: Key Concepts and Techniques
Interactive Video
•
Mathematics
•
8th - 12th Grade
•
Practice Problem
•
Hard
Standards-aligned

Emma Peterson
FREE Resource
Standards-aligned
10 questions
Show all answers
1.
MULTIPLE CHOICE QUESTION
30 sec • 1 pt
What is the first step in graphing a piecewise function?
Determine the behavior of each piece
Plot the graph
Identify the intervals
Check the border points
Tags
CCSS.HSF-IF.C.7B
2.
MULTIPLE CHOICE QUESTION
30 sec • 1 pt
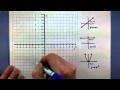
How many pieces does the given piecewise function have?
Three
Four
One
Two
Tags
CCSS.HSF-IF.C.7B
3.
MULTIPLE CHOICE QUESTION
30 sec • 1 pt
What type of graph does the expression y = x + 1 represent?
Parabola
Linear line
Horizontal line
Vertical line
4.
MULTIPLE CHOICE QUESTION
30 sec • 1 pt
Which expression represents a horizontal line?
y = x - 1
y = x^2
y = 5
y = x + 1
5.
MULTIPLE CHOICE QUESTION
30 sec • 1 pt
In which interval does the function behave like y = x + 1?
x < -3
x > 0
x = 0
x between -3 and 0
Tags
CCSS.HSF-IF.C.7B
6.
MULTIPLE CHOICE QUESTION
30 sec • 1 pt
What does the function look like for x values between -3 and 0?
Vertical line
Linear line
Parabola
Horizontal line at y = 5
7.
MULTIPLE CHOICE QUESTION
30 sec • 1 pt
Where should the line y = x + 1 be drawn on the graph?
Everywhere
Only in the section where x < -3
Only in the section where x > 0
Only in the section where x = 0
Access all questions and much more by creating a free account
Create resources
Host any resource
Get auto-graded reports
Continue with Google

Continue with Email
Continue with Classlink
Continue with Clever
or continue with
Microsoft
%20(1).png)
Apple
Others
Already have an account?
Popular Resources on Wayground

7 questions
History of Valentine's Day
Interactive video
•
4th Grade
15 questions
Fractions on a Number Line
Quiz
•
3rd Grade
20 questions
Equivalent Fractions
Quiz
•
3rd Grade
25 questions
Multiplication Facts
Quiz
•
5th Grade
22 questions
fractions
Quiz
•
3rd Grade
15 questions
Valentine's Day Trivia
Quiz
•
3rd Grade
20 questions
Main Idea and Details
Quiz
•
5th Grade
20 questions
Context Clues
Quiz
•
6th Grade
Discover more resources for Mathematics
20 questions
Laws of Exponents
Quiz
•
8th Grade
20 questions
Graphing Inequalities on a Number Line
Quiz
•
6th - 9th Grade
20 questions
Exponent Properties
Quiz
•
9th Grade
16 questions
2022 Winter Olympics Medal Table
Passage
•
6th - 8th Grade
20 questions
Complementary Supplementary Vertical Adjacent Angles
Quiz
•
8th Grade
20 questions
One Step equations addition and subtraction
Quiz
•
5th - 8th Grade
12 questions
Volume of cones and cylinders
Quiz
•
8th Grade
20 questions
Slope from a Graph
Quiz
•
8th Grade