Exploring Average Speed through Graphs
Interactive Video
•
Science
•
6th - 10th Grade
•
Practice Problem
•
Hard
Standards-aligned

Jackson Turner
FREE Resource
Standards-aligned
10 questions
Show all answers
1.
MULTIPLE CHOICE QUESTION
30 sec • 1 pt
What is the formula for speed?
Speed = Distance / Time
Speed = Distance x Time
Speed = Distance + Time
Speed = Time / Distance
Tags
NGSS.MS-PS3-1
2.
MULTIPLE CHOICE QUESTION
30 sec • 1 pt
In a speed graph, what does the y-axis typically represent?
Distance
Time
Acceleration
Speed
3.
MULTIPLE CHOICE QUESTION
30 sec • 1 pt
If an object travels 400 meters in 8 seconds, what is its speed?
40 m/s
60 m/s
50 m/s
70 m/s
Tags
NGSS.MS-PS3-1
4.
MULTIPLE CHOICE QUESTION
30 sec • 1 pt
What is the speed of an object that travels 100 meters in 5 seconds?
15 m/s
20 m/s
10 m/s
25 m/s
5.
MULTIPLE CHOICE QUESTION
30 sec • 1 pt
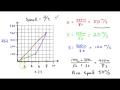
If an object travels from 100 meters to 400 meters in 3 seconds, what is its speed during this interval?
50 m/s
125 m/s
75 m/s
100 m/s
6.
MULTIPLE CHOICE QUESTION
30 sec • 1 pt
What is the average speed of an object that travels 400 meters in 8 seconds?
45 m/s
40 m/s
50 m/s
55 m/s
Tags
NGSS.MS-PS3-1
7.
MULTIPLE CHOICE QUESTION
30 sec • 1 pt
How does the speed graph look for an object moving at a constant speed?
A horizontal line
A zigzag line
A straight line
A curved line
Access all questions and much more by creating a free account
Create resources
Host any resource
Get auto-graded reports
Continue with Google

Continue with Email
Continue with Classlink
Continue with Clever
or continue with
Microsoft
%20(1).png)
Apple
Others
Already have an account?
Popular Resources on Wayground

15 questions
Fractions on a Number Line
Quiz
•
3rd Grade
20 questions
Equivalent Fractions
Quiz
•
3rd Grade
25 questions
Multiplication Facts
Quiz
•
5th Grade
22 questions
fractions
Quiz
•
3rd Grade
20 questions
Main Idea and Details
Quiz
•
5th Grade
20 questions
Context Clues
Quiz
•
6th Grade
15 questions
Equivalent Fractions
Quiz
•
4th Grade
20 questions
Figurative Language Review
Quiz
•
6th Grade
Discover more resources for Science
33 questions
Grade 6 Quarter 3 PMA 5 Review
Quiz
•
6th - 8th Grade
85 questions
Midpoint D1 Review
Quiz
•
8th Grade
20 questions
Rocks and The Rock Cycle
Quiz
•
6th Grade
12 questions
Ecological Succession
Quiz
•
7th Grade
12 questions
Newton's Laws of Motion
Lesson
•
6th - 8th Grade
10 questions
Exploring the Rock Cycle: Types and Formation
Interactive video
•
6th - 8th Grade
10 questions
Exploring the Layers of the Earth
Interactive video
•
6th - 10th Grade
20 questions
Pure Substances & Mixtures
Quiz
•
8th Grade