Exploring Measures of Central Tendency: Mean, Median, Mode, and Range
Interactive Video
•
Mathematics
•
6th - 10th Grade
•
Practice Problem
•
Medium
+1
Standards-aligned

Liam Anderson
Used 17+ times
FREE Resource
Standards-aligned
Read more
10 questions
Show all answers
1.
MULTIPLE CHOICE QUESTION
30 sec • 1 pt
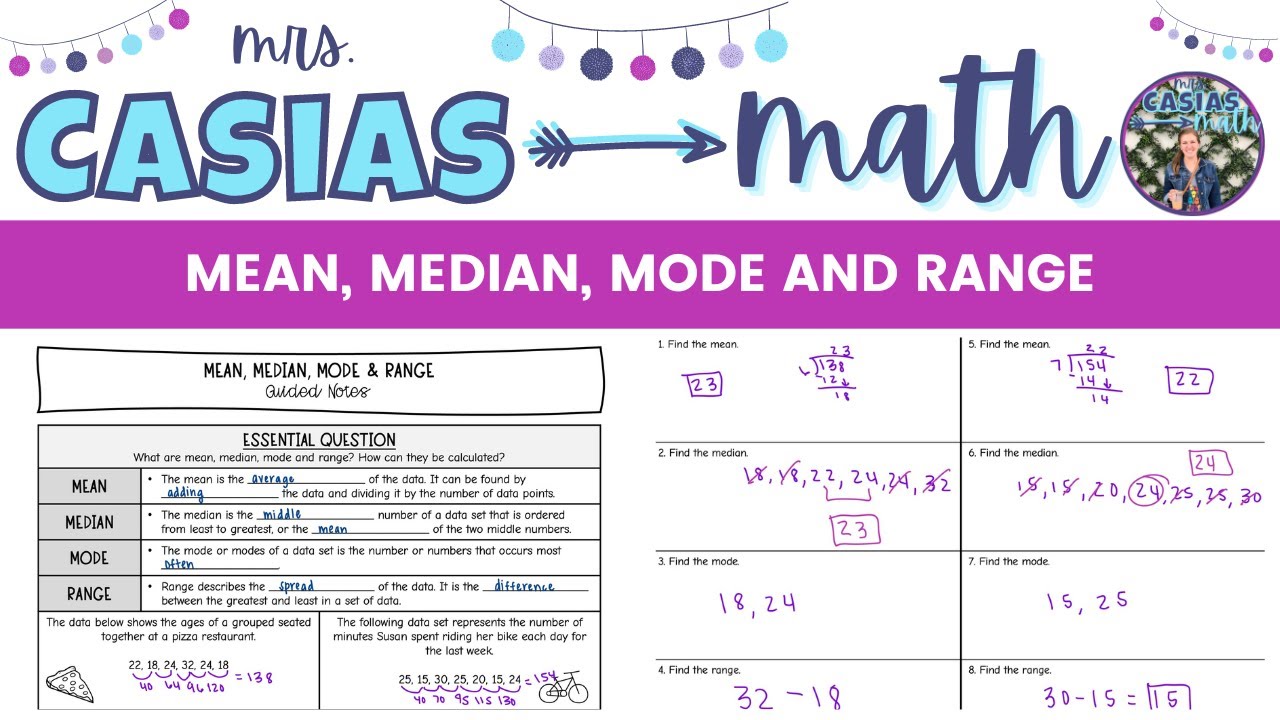
What is the mean of a dataset?
The middle value when data is ordered
The most frequently occurring value
The difference between the highest and lowest values
The average value of the dataset
Tags
CCSS.6.SP.B.5C
2.
MULTIPLE CHOICE QUESTION
30 sec • 1 pt
Which of the following is true about calculating the mean?
It is the same as the median in all datasets
It requires dividing the sum of all data points by their count
It is found by subtracting the smallest value from the largest
It involves multiplying all data points
Tags
CCSS.6.SP.B.5C
3.
MULTIPLE CHOICE QUESTION
30 sec • 1 pt
How is the median found if the dataset has an even number of values?
By selecting the higher of the two middle values
By selecting the lower of the two middle values
By averaging the two middle values
By taking the middle value directly
Tags
CCSS.6.SP.B.5C
4.
MULTIPLE CHOICE QUESTION
30 sec • 1 pt
What was the mean age of the group at the pizza restaurant?
25
24
23
22
Tags
CCSS.6.SP.B.5C
5.
MULTIPLE CHOICE QUESTION
30 sec • 1 pt
What does the mode represent in a dataset?
The average of all values
The middle value of the dataset
The difference between the highest and lowest values
The value that appears most frequently
Tags
CCSS.6.SP.B.5C
6.
MULTIPLE CHOICE QUESTION
30 sec • 1 pt
How is the range of a dataset calculated?
By dividing the sum of all values by the number of values
By counting the number of values in the dataset
By subtracting the lowest value from the highest value
By adding the highest and lowest values
Tags
CCSS.6.SP.B.4
CCSS.HSS.ID.A.1
7.
MULTIPLE CHOICE QUESTION
30 sec • 1 pt
What were the modes in the age dataset?
18 and 24
24 and 32
18 and 32
22 and 32
Tags
CCSS.6.SP.B.5C
Access all questions and much more by creating a free account
Create resources
Host any resource
Get auto-graded reports
Continue with Google

Continue with Email
Continue with Classlink
Continue with Clever
or continue with
Microsoft
%20(1).png)
Apple
Others
Already have an account?
