Exploring Bar Graphs and Pictographs in Math
Interactive Video
•
Mathematics
•
6th - 10th Grade
•
Practice Problem
•
Hard
Standards-aligned

Jackson Turner
FREE Resource
Standards-aligned
Read more
10 questions
Show all answers
1.
MULTIPLE SELECT QUESTION
30 sec • 1 pt
What are two ways students can participate in the graph-building activity?
Discussing their findings in a group without creating graphs
Using only paper and pencil
Making a list or a tally chart and then working individually or in pairs
Using an interactive whiteboard or data projector
Tags
CCSS.2.MD.D.10
2.
MULTIPLE CHOICE QUESTION
30 sec • 1 pt
Why is it important for students to use concrete manipulatives in graphing?
To reduce the use of technology in the classroom
To make the activity more challenging
To improve their handwriting
To enhance their understanding of data representation
Tags
CCSS.1.MD.C.4
3.
MULTIPLE CHOICE QUESTION
30 sec • 1 pt
What is a key aspect of data analysis emphasized in the lesson?
Memorizing data
Interpreting graphical representations
Avoiding the use of colors in graphs
Focusing solely on technology
Tags
CCSS.3.MD.B.3
4.
MULTIPLE CHOICE QUESTION
30 sec • 1 pt
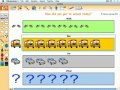
What is the most common way students got to school according to the graph?
By bus
Walking
Skating
Riding in a car
Tags
CCSS.2.MD.D.10
5.
MULTIPLE CHOICE QUESTION
30 sec • 1 pt
What does a longer row of buses on the graph indicate?
The bus was late
More students took the bus
More students walked to school
Fewer students took the bus
Tags
CCSS.2.MD.D.10
6.
MULTIPLE CHOICE QUESTION
30 sec • 1 pt
What could the 'other' category in the graph represent?
Students who teleported to school
Students who biked or skated to school
Students who did not attend school
Students who used a hoverboard
7.
MULTIPLE CHOICE QUESTION
30 sec • 1 pt
How can students personalize their bar graphs?
By choosing colors that have meaning to them
By avoiding the use of symbols
By using only black and white
By creating graphs as tall as possible
Tags
CCSS.2.MD.D.10
Access all questions and much more by creating a free account
Create resources
Host any resource
Get auto-graded reports
Continue with Google

Continue with Email
Continue with Microsoft
or continue with

%20(1).png)
Apple
Others
Already have an account?
