Exploring Bar Graphs and Pictographs in Grade 3 Math
Interactive Video
•
Mathematics
•
6th - 10th Grade
•
Practice Problem
•
Hard
+5
Standards-aligned

Emma Peterson
Used 1+ times
FREE Resource
Standards-aligned
10 questions
Show all answers
1.
MULTIPLE CHOICE QUESTION
30 sec • 1 pt
What do both bar graphs and pictographs count in the example given?
Number of students
Types of animals
Number of sports played
Favorite colors
Tags
CCSS.2.MD.D.10
2.
MULTIPLE CHOICE QUESTION
30 sec • 1 pt
How is data represented differently in a pictograph compared to a bar graph?
Using numbers
Using pictures
Using words
Using shapes
Tags
CCSS.2.MD.D.10
3.
MULTIPLE CHOICE QUESTION
30 sec • 1 pt
What helps you count data in a bar graph?
Numbers
Labels
Colors
Pictures
Tags
CCSS.2.MD.D.10
4.
MULTIPLE CHOICE QUESTION
30 sec • 1 pt
How can you make the numbers in a pictograph match the bar graph data?
Use a key to adjust picture value
Add more pictures
Remove some pictures
Change the pictures
Tags
CCSS.3.MD.B.3
5.
MULTIPLE CHOICE QUESTION
30 sec • 1 pt
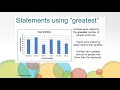
Which statement uses the word 'greatest' correctly based on bar graph data?
Giraffes had the greatest number of visitors.
The least number of people visited the gorillas.
Elephants saw fewer visitors than tigers.
Gorillas were visited by the greatest number of people.
Tags
CCSS.3.MD.B.3
6.
MULTIPLE CHOICE QUESTION
30 sec • 1 pt
What is needed to complete a statement about the total number of zoo visitors?
Add the number of people visiting each animal
Subtract the number of visitors
Add the number of animals
Multiply the number of animals by visitors
Tags
CCSS.3.OA.D.8
7.
MULTIPLE CHOICE QUESTION
30 sec • 1 pt
What does a pictograph use to represent information?
Pictures
Words
Numbers
Bars
Tags
CCSS.2.MD.D.10
Access all questions and much more by creating a free account
Create resources
Host any resource
Get auto-graded reports
Continue with Google

Continue with Email
Continue with Microsoft
or continue with

%20(1).png)
Apple
Others
Already have an account?
