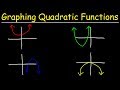
Graphing Quadratic Functions Through Transformations
Interactive Video
•
Mathematics
•
8th - 12th Grade
•
Practice Problem
•
Hard
Standards-aligned

Sophia Harris
FREE Resource
Standards-aligned
Read more
10 questions
Show all answers
1.
MULTIPLE CHOICE QUESTION
30 sec • 1 pt
What shape does the graph of y = x^2 resemble?
A straight line
An S-shape
A U-shape
A downward opening curve
Tags
CCSS.HSF-IF.C.7A
2.
MULTIPLE CHOICE QUESTION
30 sec • 1 pt
What happens to the graph of y = x^2 when a negative sign is placed in front of x^2?
It shifts to the right
It reflects over the y-axis
It reflects over the x-axis
It opens upwards
3.
MULTIPLE CHOICE QUESTION
30 sec • 1 pt
What transformation does y = x^2 + 2 represent?
Reflection over the x-axis
Shift 2 units to the right
Shift 2 units upward
Shift 2 units downward
4.
MULTIPLE CHOICE QUESTION
30 sec • 1 pt
How does adding a constant to y = x^2 affect its graph?
Shifts it upward
Shifts it downward
Reflects it over the x-axis
No effect
5.
MULTIPLE CHOICE QUESTION
30 sec • 1 pt
What effect does subtracting a number from x^2 have on its graph?
Shifts it upward
Reflects it over the y-axis
Shifts it downward
No effect
6.
MULTIPLE CHOICE QUESTION
30 sec • 1 pt
What does the transformation y = (x - 1)^2 do to the graph of y = x^2?
Shifts it 1 unit down
Shifts it 1 unit up
Shifts it 1 unit right
Shifts it 1 unit left
7.
MULTIPLE CHOICE QUESTION
30 sec • 1 pt
How does the graph of y = x^2 change when x is replaced with x + 2?
Shifts 2 units up
Shifts 2 units left
Shifts 2 units down
Shifts 2 units right
Access all questions and much more by creating a free account
Create resources
Host any resource
Get auto-graded reports
Continue with Google

Continue with Email
Continue with Classlink
Continue with Clever
or continue with
Microsoft
%20(1).png)
Apple
Others
Already have an account?
Popular Resources on Wayground

15 questions
Fractions on a Number Line
Quiz
•
3rd Grade
20 questions
Equivalent Fractions
Quiz
•
3rd Grade
25 questions
Multiplication Facts
Quiz
•
5th Grade
54 questions
Analyzing Line Graphs & Tables
Quiz
•
4th Grade
22 questions
fractions
Quiz
•
3rd Grade
20 questions
Main Idea and Details
Quiz
•
5th Grade
20 questions
Context Clues
Quiz
•
6th Grade
15 questions
Equivalent Fractions
Quiz
•
4th Grade
Discover more resources for Mathematics
14 questions
finding slope from a graph
Quiz
•
8th Grade
20 questions
Laws of Exponents
Quiz
•
8th Grade
12 questions
8th U5L9 Linear Models
Quiz
•
8th Grade
20 questions
Graphing Inequalities on a Number Line
Quiz
•
6th - 9th Grade
18 questions
SAT Prep: Ratios, Proportions, & Percents
Quiz
•
9th - 10th Grade
20 questions
Volume of cylinders, Cones and Spheres
Quiz
•
8th Grade
12 questions
Exponential Growth and Decay
Quiz
•
9th Grade
20 questions
One Step equations addition and subtraction
Quiz
•
5th - 8th Grade